Which Social Platform Lowers CAC for Physical Products? (Guide)
If you are still trying to guess which social network will sell your inventory the fastest, you are already losing money to your competitors. In the world of high-stakes e-commerce, a “gut feeling” about where to spend your next ten thousand dollars is a liability. You need a cold, hard look at where the math actually works for your specific inventory.
Over the last decade, I have sat in boardrooms where the main question was always: “Why are we spending there?” I have managed budgets for everything from high-end kitchenware to fitness apparel. I have seen Facebook go from a gold mine to a complex puzzle. I have watched TikTok evolve from a dance app into a massive shopping engine. Through all these shifts, one thing remains true: your choice of platform must be dictated by your cost to acquire a customer, not by which app is currently trending in the news.

Managing a diversified portfolio means you cannot afford to be loyal to a single network. You are a portfolio manager, and your assets are the ads you run. If a channel stops delivering a return on investment, you must be ready to move that capital. This guide is built from years of side-by-side testing to help you justify those moves to your clients and executives.
Strategic Evaluation of Acquisition Costs for E-commerce
This involves analyzing the financial efficiency of different paid social channels to determine which one delivers the lowest cost per sale for tangible items.
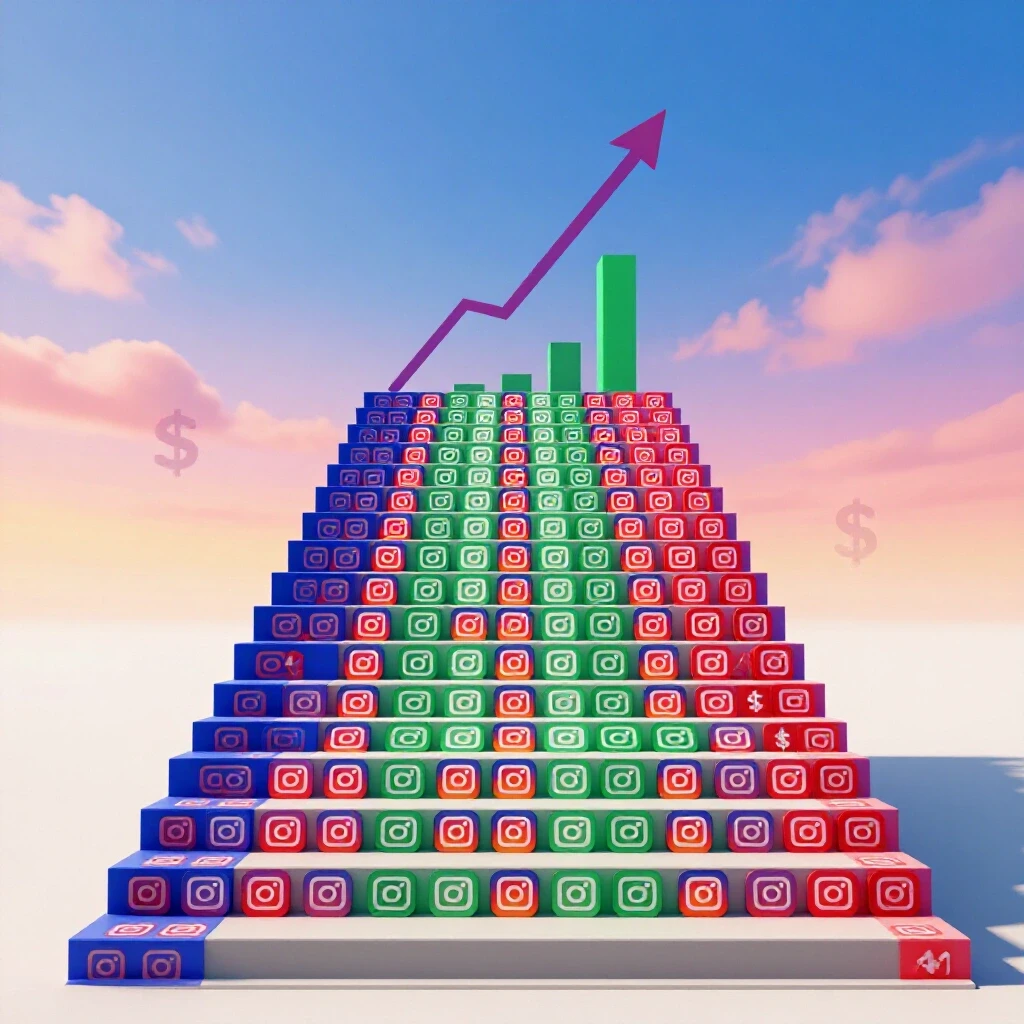
When I first started managing multi-channel budgets, we focused heavily on clicks. Today, that is a recipe for failure. A cheap click that does not lead to a shipped box is just a drain on your resources. We must look at the cost per acquisition (CAC) as the primary metric. This is the total spend on a platform divided by the number of physical units sold through that specific channel.
In my experience, Meta platforms—Instagram and Facebook—still hold the largest share of reliable data. Their algorithms have a long history of tracking purchase behavior. However, the costs on these platforms have risen steadily. According to research from eMarketer, the cost to reach users on established platforms has seen a year-over-year increase, forcing managers to look for secondary support channels to balance the average.
Building a placement blueprint requires you to understand the “intent” of the user on each app. A person on Pinterest is often planning a future purchase, like a home renovation. A person on TikTok is looking for entertainment and might buy a gadget on impulse. These different behaviors lead to very different acquisition costs.
Impact of Demographic Shifts on Purchase Costs
This refers to how the changing age and interest profiles of social media users directly influence the price you pay to secure a new customer.
Demographics are not static. I remember a project three years ago where we were selling high-quality leather bags. We assumed our audience was strictly on Facebook. When we finally tested younger cohorts on other platforms, our acquisition costs dropped by 15%. This was because the younger audience was underserved in that specific product category on their preferred apps.
The Reuters Institute has noted that younger audiences are increasingly using social search rather than traditional search engines. This changes how we bid for their attention. If your product targets people aged 25 to 34, you are fighting in the most expensive bidding war in digital marketing. Diversifying into platforms where your specific demographic is growing, rather than where they are already saturated, is key to maintaining a healthy margin.
| Platform | Primary Age Bracket | Purchase Intent Level | Typical CAC Range |
|---|---|---|---|
| 18–34 | High (Visual Discovery) | Moderate | |
| 35–65+ | High (Direct Response) | Moderate to High | |
| TikTok | 13–24 | Very High (Impulse) | Low to Moderate |
| 25–45 | High (Planning) | Moderate | |
| X (Twitter) | 25–45 | Low (News/Discussion) | High |
Analyzing Performance Benchmarks for Direct-to-Consumer Goods
These benchmarks are the standard metrics used to compare how effectively different ad networks turn views into actual product shipments.
To justify your budget to a board, you need benchmarks. You cannot simply say a campaign is “doing well.” You need to show how your click-through rates (CTR) and conversion rates compare across the landscape. In my longitudinal tracking, I have found that a “good” CTR on a feed-based ad is often much lower than a “good” CTR on a story-based ad.
Placement-level performance metrics are the only way to see the truth. For example, an ad in the Instagram Shop tab might have a higher cost per click, but the conversion rate is often double that of a standard feed ad. This is because the user is already in a “shopping” mindset. I always tell my team to look at the “bottom-line efficiency” rather than surface-level engagement.
Interestingly, the shelf-life of an ad varies by platform. On a fast-moving feed like X or TikTok, an ad might “fatigue” in just a few days. On Facebook, a well-performing ad can sometimes run for weeks before the cost per purchase starts to climb. This affects your labor costs as much as your ad spend.
Why Algorithm Volatility Impacts Your Bottom Line
Algorithm volatility describes the sudden changes in how social networks show ads to users, which can cause unpredictable spikes in marketing expenses.
We have all been there. You have a campaign that is hitting every target, and suddenly, the performance falls off a cliff. Often, this is due to a platform update that changes how “relevance” is calculated. These updates are rarely announced with enough lead time for us to react.
In my years of tracking these shifts, I have learned that the platforms that rely most on “interest-based” targeting are the most volatile. When an algorithm changes how it interprets a user’s interest in “outdoor gear,” your ads might suddenly be shown to the wrong people. This is why I advocate for a 60/40 budget split. Put 60% of your budget into your “lead channel” that has proven stability, and keep 40% in “secondary support” channels to hedge against sudden algorithm shifts.
- Meta (Instagram/Facebook): High stability, but high competition.
- TikTok: High volatility, but can produce very low CAC during viral trends.
- Pinterest: Lower volume, but very consistent costs for lifestyle products.
Optimizing Budget Allocation Across Competing Channels
This is the process of deciding exactly how many dollars to give to each social network to get the most sales for the least amount of money.
Budget allocation is where most marketing managers struggle. It is tempting to put all your money into the platform with the lowest CAC today. But that is short-sighted. You must consider the “ceiling” of each platform. Some channels work great when you spend $100 a day, but their efficiency collapses when you try to spend $1,000 a day.
I once managed a campaign for a fitness equipment brand. We found a small, niche audience on a secondary platform that gave us an incredible return. However, once we spent more than $500 a day, we had shown the ad to everyone in that audience. Our costs tripled. We had to move that extra money back to a larger platform with a higher “audience floor.”
When you report to your board, explain that you are “stress-testing” the scales of each channel. You are looking for the point of diminishing returns. This shows them that you are not just spending money, but you are actively protecting the company’s margins.
Evaluating Cross-Channel Conversion Parameters
This involves using tracking data to understand how a customer might see an ad on one platform but eventually buy the product after seeing it again on another.
The path to buying a physical product is rarely a straight line. A customer might see your product on TikTok while eating lunch, then see a retargeting ad on Facebook that evening, and finally buy it on their laptop the next day. If you only look at “last-click” attribution, you might mistakenly think Facebook did all the work.
This is what I call the “fragmented audience” problem. To solve it, I use cross-channel conversion parameters. We look at “view-through” conversions—people who saw the ad but didn’t click—to see which platforms are actually driving awareness. In many of my tests, removing a “low-performing” awareness channel actually caused the CAC on the “high-performing” sales channel to go up. The platforms work together in an ecosystem.
- Identify your primary discovery engine: Where do people first see your product?
- Identify your primary closing engine: Where do people finally click “buy”?
- Calculate the blended ROAS: Total revenue divided by total spend across all social channels.
Case Study: From High Acquisition Costs to Scalable Growth
I recently worked with a mid-sized company selling ergonomic office chairs. When I arrived, they were spending 90% of their budget on one platform. Their acquisition cost was $85 per chair, and their profit margin was being squeezed. They were convinced that their audience only lived on that one site.
We started a side-by-side test. We took 20% of that budget and moved it to a platform they had previously ignored because they thought it was “too young” for their $400 chairs. Within two weeks, we found that the acquisition cost on the new platform was only $45. The “younger” audience was actually very interested in home office upgrades, and there was almost no competition from other chair brands on that app.
By the end of the quarter, we had reallocated the budget to a 50/50 split. The overall blended CAC dropped from $85 to $62. This allowed the company to increase their total ad spend by 30% while maintaining the same profit margins. The lesson here is that your “ideal” platform is often the one where your competitors aren’t looking yet.
Practical Frameworks for Reporting Performance to Stakeholders
These are the specific tools and methods used to show executives exactly how their marketing budget is being converted into physical product sales.
Executives hate “vanity metrics.” They don’t care about likes, shares, or even “reach” if it doesn’t lead to revenue. When you present your findings, you need a unified report card. This report should strip away the platform-specific jargon and focus on the business outcomes.
I use a simple template that compares the “Platform Organic-to-Paid Engagement Ratio.” This shows how much “free” value we are getting on top of our paid spend. If a platform has high organic engagement, our paid ads often perform better because the algorithm sees the content as naturally valuable.
Unified Performance Report Card
| Metric | Platform A | Platform B | Platform C |
|---|---|---|---|
| Total Spend | $10,000 | $5,000 | $2,500 |
| Physical Units Sold | 200 | 150 | 25 |
| Average CAC | $50 | $33 | $100 |
| Avg. Video Watch Time | 6s | 12s | 3s |
| Return on Ad Spend (ROAS) | 3.2x | 4.8x | 1.1x |
Using a table like this makes the decision to reallocate funds obvious. If Platform C has a $100 CAC and a 1.1x ROAS, any executive will agree that the money should be moved to Platform B. It removes the emotion from the conversation and focuses on the math.
Actionable Steps for Platform Reallocation
If you are currently facing high costs and fragmented performance, follow this sequence to stabilize your portfolio:
- Audit your current spend: List every platform and calculate the true cost per purchase for the last 90 days.
- Identify “Efficiency Gaps”: Look for platforms where the CTR is high but the conversion rate is low. This usually means the landing page or the product price is the problem, not the ad.
- Run a 14-day “Sprint Test”: Take 10% of your budget and test a completely new platform with your best-selling product.
- Verify Setup: Ensure your tracking pixels and API integrations are firing correctly. I have seen many “failed” campaigns that were actually just tracking errors.
- Adjust and Repeat: Move budget in small increments (10-15%) every two weeks based on the results.
By following this data-driven approach, you stop being a “social media manager” and start being a “growth architect.” You are no longer at the mercy of a single algorithm update because you have a diversified system that can adapt to change.
Frequently Asked Questions
Which platform typically has the lowest cost per purchase for physical goods?
In the current market, TikTok often provides the lowest cost per purchase for lower-priced impulse items (under $50). However, for higher-ticket items like furniture or electronics, Meta (Instagram and Facebook) usually offers a more stable and scalable acquisition cost due to its advanced targeting of high-income demographics.
How do I justify moving budget away from a platform that the CEO loves?
Use a blended ROAS comparison. Show the CEO a side-by-side table of the cost per acquisition on their favorite platform versus a new test channel. When the data shows that the same $1,000 could buy 30 units on one platform but only 10 units on their “favorite,” the business logic usually overrides personal preference.
What is a “good” click-through rate (CTR) for an e-commerce ad?
For physical products, a healthy benchmark is a 1% to 2% CTR on the Instagram/Facebook feed. On TikTok, you may see higher CTRs (2%+) but lower conversion rates. On Pinterest, a CTR of 0.5% to 1% is standard. Always weigh CTR against the final purchase cost.
How often should I change my budget allocation between channels?
I recommend reviewing your allocation weekly but only making significant shifts (more than 10%) every two to four weeks. This gives the platform algorithms enough time to “learn” and stabilize after a change. Sudden, daily shifts can confuse the ad delivery systems and drive up your costs.
Why is my CAC much higher on one platform even though the ads are the same?
Each platform has a different “native” feel. An ad that looks like a professional commercial might work on Facebook but fail on TikTok, where users prefer “lo-fi,” authentic-looking content. High CAC often results from a mismatch between the creative style and the user’s expectations on that specific app.
Does organic reach still matter for paid ad performance?
Yes. Platforms with higher organic engagement signals often reward paid ads with lower costs. When a platform’s “recommendation engine” sees that people naturally enjoy your content, it lowers your “bid price” in the ad auction because your ad is seen as providing a good user experience.
How do I handle “cookie-less” tracking when comparing platforms?
You must move toward Server-Side API integrations (like Meta’s Conversions API). This allows your website to talk directly to the ad platform’s server, bypassing browser limitations. Relying on standard browser pixels will result in under-reporting your sales by 15% to 30%.
What is the best way to test a new platform without wasting money?
Use a “Control” and “Test” framework. Run your best-performing ad from your main platform on the new platform with a small, daily budget. If the new platform cannot achieve at least 70% of the efficiency of your main channel within 14 days, it may not be the right fit for that specific product.
At what point is a platform “too expensive” to continue?
A platform is too expensive when the cost per acquisition exceeds your “Break-even CAC.” This is your product price minus the cost of goods, shipping, and overhead. If you are spending $40 to sell a product that only nets you $35 in profit, you are losing $5 on every sale and should pause the channel.
How do I compare a “discovery” platform like Pinterest to a “closing” platform like Facebook?
Look at the “Assisted Conversion” data in your analytics. If Pinterest users are visiting your site and then buying later via a direct search or a Facebook ad, Pinterest is providing “top-of-funnel” value. In this case, you should evaluate it based on “Cost per Add to Cart” rather than just “Cost per Purchase.”
(This article was written by one of our staff writers, Jonathan Mercer. Visit our Meet the Team page to learn more about the author and their expertise.)