How to Discover What Your Social Media Audience Wants (Guide)
In the early 1920s, Claude Hopkins, a pioneer of modern advertising, revolutionized the industry by insisting that every ad be a tracked experiment. He used coded coupons to measure exactly which headlines drove sales, moving marketing away from guesswork and toward a measurable science. Today, as I manage campaigns across Instagram, TikTok, and LinkedIn, the coupons have been replaced by API-driven metrics, but the core challenge remains the same. We often think we know what our followers want, only to watch a high-production video result in a flatline of engagement.
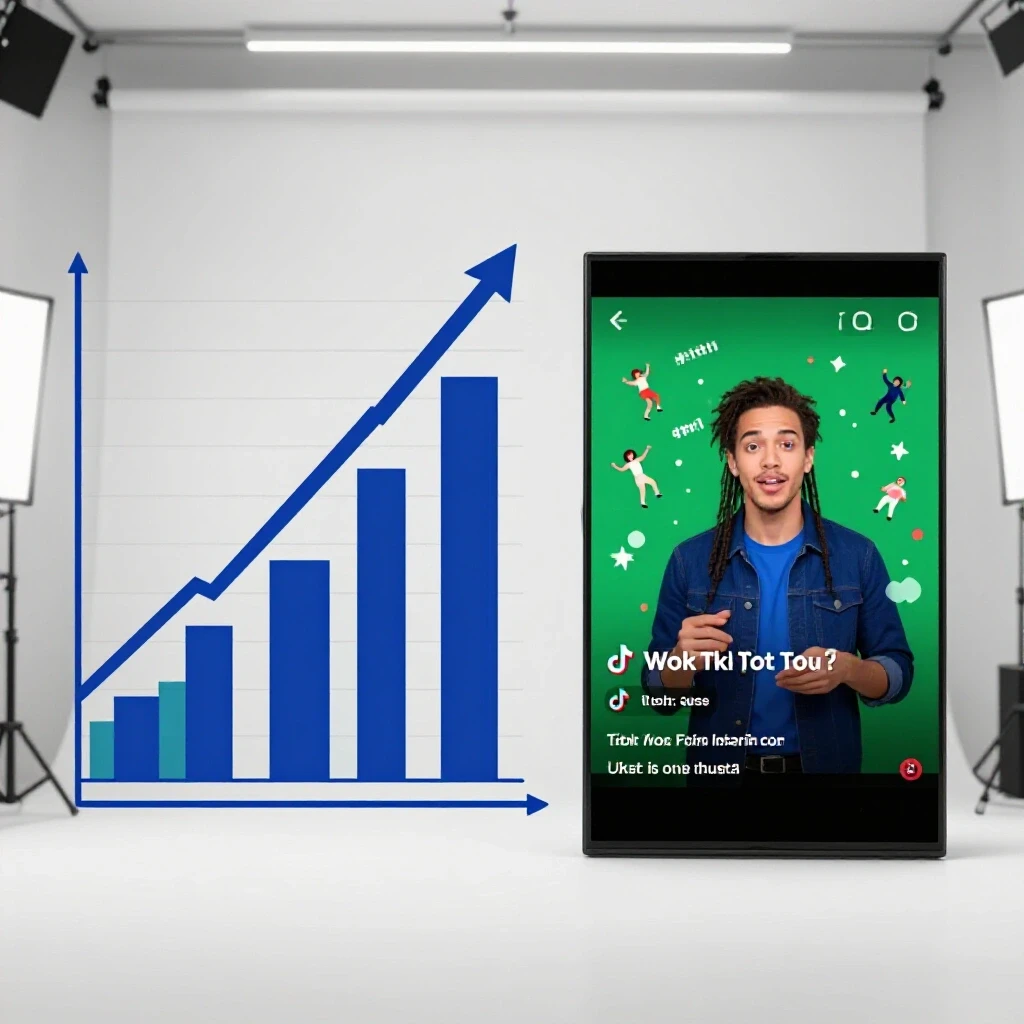
Over the last 11 years, I have tracked the full lifecycle of more than 40 account growth journeys. These haven’t all been straight lines to the top. In fact, many involved mid-campaign stalls where the initial social media growth strategy simply stopped working. By documenting every pivot and failed experiment, I discovered that the data was always telling a story, even when it was telling me I was wrong. For intermediate marketers, the goal is to stop guessing and start interpreting these signals to build a sustainable path forward.

Establishing a Baseline for Multi-Platform Organic Growth
Defining baseline metrics involves identifying the standard performance levels of an account over a 30-day period before any new strategy is applied. This creates a control group that allows you to see if your new tactics are actually driving progress or if you are just riding a temporary platform wave.
When I begin a new project, I never look at “viral” hits as the standard. Instead, I look for the floor—the minimum engagement an average post receives. According to Pew Research Center studies on digital engagement, user behavior varies wildly by platform, meaning a “good” engagement rate on LinkedIn is not the same as one on TikTok. I use a 70/20/10 budget and effort split to manage this. 70% of content follows the proven baseline, 20% tests slight variations, and 10% is high-risk experimentation.
- Baseline Engagement Rate: The average interactions per post divided by total followers over 30 days.
- Reach-to-Follower Ratio: How many non-followers see your content compared to your existing base.
- Retention Rate: For video platforms like TikTok, the percentage of viewers who watch past the first three seconds.
Building on this, I have found that most stagnation occurs because marketers skip this audit phase. They jump straight into a new social media growth strategy without knowing their starting coordinates. Without a baseline, you cannot prove to a client that a pivot is working. You need to show that the “floor” has moved higher, even if the “ceiling” hasn’t been hit yet.
Decoding Audience Intent Through Algorithmic Adaptation
Algorithmic adaptation is the process of adjusting content formats and delivery based on how platform-native AI prioritizes specific user interactions. It requires looking past “vanity metrics” like likes to focus on “intent metrics” like shares, saves, and watch time that signal true audience interest.
Interestingly, Meta’s advertising transparency reports often highlight that high-performing ads mirror the organic content that earns the most “meaningful social interactions.” This means the algorithm is essentially a giant feedback loop. If your Instagram Reels are getting views but no saves, the data is telling you that the content is entertaining but not valuable enough to revisit. I learned this the hard way with a fitness client whose high-energy montages got 50,000 views but zero lead conversions.
Understanding Platform-Native Retention Rules
Each platform has a “logic” for how it distributes reach. On TikTok, the algorithm prioritizes the “completion rate.” If users don’t finish your video, your reach will likely drop off a cliff after the first hour. On LinkedIn, the “dwell time”—how long someone stays on your post—is a primary driver for algorithmic distribution.
- TikTok: Focuses on the “re-watch” factor and total play time.
- Instagram: Heavily weights “saves” and “direct shares” as signals of quality.
- LinkedIn: Values “comments” that spark further conversation and long-form reading time.
As a result, I shifted my strategy to focus on “saveable” carousels on Instagram and “conversational” text posts on LinkedIn. This wasn’t a guess; it was a response to the data showing that these formats had a 30% higher reach-to-follower ratio than standard images. By adapting to these rules, you work with the platform rather than fighting against it.
Identifying the Pivot Trigger: When Data Signals Stagnation
A pivot trigger is a specific, pre-defined numerical threshold that indicates a campaign is no longer meeting its objectives and requires a change in strategy. Setting these benchmarks beforehand prevents emotional decision-making and helps justify strategic shifts to management or clients.
In my experience, the hardest part of campaign lifecycle management is knowing when to quit. We often stay with a failing strategy because we’ve already spent the budget. However, I use a 14-day observation period. If a campaign shows a 20% decline in reach over two consecutive weeks without an external cause, that is a clear pivot trigger.
| Metric Indicator | Status | Action Required |
|---|---|---|
| CTR below 0.8% on Paid Ads | Underperforming | Refresh creative or adjust targeting |
| Organic Reach < 5% of Followers | Stagnant | Change content format (e.g., Image to Video) |
| Engagement Rate Drop > 15% | Fatigue | Audit audience sentiment and comments |
| Save Rate < 1% of Reach | Low Value | Increase educational or utility-based content |
For example, I once managed a LinkedIn campaign for a SaaS company that stalled after three months of steady growth. The data showed that while our impressions stayed high, our comment-to-view ratio dropped by half. This told me the audience was seeing the content but no longer felt the need to interact. We pivoted from “how-to” guides to “controversial opinion” posts, which restored engagement levels within 10 days.
Marketing Trend Analysis: Bridging the Gap Between Paid and Organic
Marketing trend analysis involves using data from both paid and organic channels to identify broader shifts in consumer behavior. By comparing how the same creative performs in a controlled paid environment versus the unpredictable organic feed, you can find hidden targeting mismatches.
I often use “dark testing” to validate organic concepts. This involves running $50–$100 worth of spend on a specific post to see how a cold audience reacts. If the paid CTR (Click-Through Rate) is high, but the organic reach is low, it usually means the algorithm hasn’t found your “pocket” of the audience yet. This is a crucial distinction. It means the content is good, but the distribution is flawed.
- Paid-to-Organic Correlation: If a paid ad has a high “save” rate, it will likely perform well as an organic “pinned” post.
- Audience Overlap: Use Meta’s audience insights to see if your organic followers match your high-converting paid customers.
- Creative Fatigue Thresholds: Track when your ad frequency hits 3.0 or higher; this is usually when performance starts to dip and you need new assets.
This data-backed approach reduces the fear of wasting ad spend. You aren’t just throwing money at a wall; you are using small amounts of capital to buy information. This information then fuels your multi-platform organic growth, creating a cycle of verified successes.
Justifying Strategic Shifts to Clients with Platform Reach Recovery Data
Platform reach recovery data refers to the documented evidence of how a strategic pivot successfully reversed a downward trend in performance. Presenting this data to stakeholders helps build professional credibility and provides a historical precedent for future decision-making.
One of the biggest pain points for freelance growth strategists is the “why did reach drop?” conversation. Instead of making excuses about the algorithm, I present a “Transition Log.” This document shows the date of the drop, the hypothesized reason, the pivot we took, and the resulting change in metrics. It turns a stressful conversation into a collaborative data review.
Creating a Pivot Report Template
When I need to justify a shift, I use a simple three-part structure: 1. The Observation: “Over the last 14 days, our average watch time on TikTok has decreased from 12 seconds to 7 seconds.” 2. The Data-Backed Hypothesis: “This suggests our ‘hooks’ are no longer capturing attention in the first 3 seconds, likely due to a shift in trending audio styles.” 3. The Proposed Pivot: “We will move 20% of our production budget to test ‘lo-fi’ talking-head videos with immediate on-screen text to re-engage viewers.”
Building on this, transparency is your best tool. When I show a client a failed experiment alongside the breakthrough that followed, it proves that I am actively managing the account, not just setting it on autopilot. They begin to value the process of discovery as much as the results themselves.
Tools and Workflows for Continuous Campaign Lifecycle Management
Effective lifecycle management requires a specific set of tools to track data across multiple platforms without manual errors. These tools help maintain a “single source of truth” for all campaign metrics, making it easier to spot trends before they become problems.
- Native Analytics Dashboards: I always start with Instagram Insights, TikTok Creator Center, and LinkedIn Page Analytics for the most accurate, first-party data.
- Third-Party Aggregators: Tools like Buffer or Sprout Social are helpful for seeing multi-platform organic growth in one view, though I always cross-reference with native data.
- Ad Transparency Tools: Use the Meta Ad Library to see what competitors are doing when your own performance plateaus; it often reveals shifts in industry-wide creative trends.
- Custom Looker Studio Reports: I build automated dashboards that pull from various APIs to track my specific “pivot triggers” in real-time.
- Notion or Trello Transition Logs: A simple place to document every change made to the strategy, including the date and the reasoning.
By using these tools, I can manage 10+ client portfolios without losing track of which experiments are running. It allows for a level of granular detail that is impossible to maintain with spreadsheets alone. You can see exactly when a specific hashtag stopped working or when a certain posting time lost its effectiveness.
Practical Benchmarks for Algorithmic Adaptation
To navigate the unpredictable nature of social media, you need clear benchmarks that tell you if you are on the right track. These aren’t “industry averages,” which are often too broad to be useful, but rather performance-based milestones specific to your account’s journey.
- The 10% Rule: Aim for an engagement rate that is at least 10% of your total reach (not followers).
- The 3-Second Hook Test: At least 60% of viewers should still be watching your video at the 3-second mark.
- The Conversion Lag: Recognize that on LinkedIn, a post may take 48–72 hours to hit its peak reach, whereas on TikTok, it often happens in the first 6 hours.
- Acceptable Variance: A 10-15% fluctuation in weekly reach is normal; anything over 25% requires an immediate audit.
I have seen many marketers panic over a single bad post. However, the data shows that social media is a game of averages. One “failed” post is just a data point; five “failed” posts in a row is a trend. By keeping your eyes on the 30-day rolling average, you can avoid the emotional rollercoaster of daily metric checking.
Conclusion and Next Steps
The transition from a reactive marketer to a data-driven strategist happens when you stop looking for “hacks” and start looking for patterns. My 11 years in the field have taught me that the audience is always talking to us through the numbers; we just have to be willing to listen, even when they are telling us our favorite idea isn’t working.
To begin applying this today, start by auditing your last 30 days of content across all platforms. Identify your “floor” metrics and set your “pivot triggers.” Document every change you make in a transition log. Over time, you will build your own library of historical precedents that will make every future decision faster, safer, and more effective.
FAQ
What is the most important metric to track for organic growth? While it varies by platform, the “Save-to-Reach” ratio is often the strongest indicator of content value. A “save” suggests that the user found the information important enough to reference later, which is a high-intent signal that algorithms like Instagram and LinkedIn reward with increased distribution.
How long should I wait before deciding a campaign has failed? I recommend a minimum observation period of 14 days for organic content and 7 days for paid ads. This allows enough time for the algorithm to test your content against different audience segments. Avoid making changes in the first 48 hours, as this can reset the “learning phase” of many platform algorithms.
How do I explain a sudden drop in reach to a client? Use a data-backed approach rather than blaming the algorithm. Show them the “Transition Log” and point out specific shifts in user behavior, such as a drop in watch time or a change in comment sentiment. Present a clear pivot plan based on these observations to show you are in control of the situation.
What is a “pivot trigger” exactly? A pivot trigger is a pre-set numerical limit. For example, “If our Click-Through Rate (CTR) drops below 1% for three days straight, we will pause the ad and change the headline.” This removes the emotion from marketing and ensures you don’t waste budget on underperforming assets.
Should I focus on TikTok, Instagram, or LinkedIn first? This depends on where your data shows the highest “Reach-to-Follower” ratio. If you are getting 1,000 views on TikTok with 10 followers, but only 100 views on Instagram with 1,000 followers, the data is telling you that TikTok’s current algorithm is more favorable for your specific content style.
How do I avoid “creative fatigue” in my campaigns? Track your ad frequency and engagement rates. When frequency rises above 3.0 and engagement starts to dip, it’s a sign that your audience has seen your content too many times. At this point, you should introduce new visuals or a different narrative angle to refresh interest.
Is paid spend necessary for organic growth? It is not strictly necessary, but it acts as an “accelerant.” Small-scale paid tests (under $100) can provide data on which hooks and topics resonate with a cold audience much faster than organic testing alone. I use paid data to “de-risk” my organic content strategy.
What is the 70/20/10 rule in social media? It is a framework for resource allocation: 70% of your content should be “proven” formats that consistently hit your baseline. 20% should be “iterations” or slight variations of successful content. 10% should be “experimental” or high-risk ideas that could lead to your next big breakthrough.
Why is “dwell time” important on LinkedIn? Dwell time measures how long a user spends looking at your post without clicking away. LinkedIn’s algorithm uses this to determine if your content is “high quality.” Long-form text posts or PDF carousels often perform well because they naturally keep users on the platform longer.
How can I track multi-platform data without feeling overwhelmed? Focus on 3-5 core KPIs that align with your business goals (e.g., Reach, Engagement Rate, and Conversions). Use an automated dashboard like Looker Studio to aggregate this data so you can see the “big picture” without manually checking every individual app every day.
(This article was written by one of our staff writers, Michael Reynolds. Visit our Meet the Team page to learn more about the author and their expertise.)