How to Analyze Video Formats for Social Media Success (Case Study)
In my first three years as a data analyst, I followed the “best practice” guides published by major platforms. I believed that if I followed their creative suggestions, my video engagement metrics would naturally climb. However, a specific experiment in 2017 changed my entire perspective. I was running a campaign for a mid-sized e-commerce brand, testing a high-production cinematic video against a raw, mobile-shot testimonial. The “expert” advice suggested the cinematic version would build more brand equity. The data showed the opposite. The raw video had a 40% higher completion rate and a significantly lower cost per acquisition. This was my first real lesson in why empirical testing must override creative intuition.

Today, after nine years of running structured social media experiments, I have learned that the only way to truly understand what works is through rigorous variable isolation. Most marketers struggle because they change too many things at once. They change the music, the hook, and the video length in a single test, making it impossible to know which change moved the needle. My goal is to help you move past that frustration. By using a data-driven content strategy, you can stop guessing and start building a library of content formats that consistently perform based on hard evidence.
Formulating a Rigorous Hypothesis for Video Content Testing
A hypothesis is a testable statement that predicts how a specific change in a video format will impact viewer behavior. It serves as the foundation for any experiment, ensuring that you are measuring specific outcomes rather than just looking for random patterns in your analytics dashboard. Without a clear hypothesis, your data analysis will lack direction and purpose.
When I begin a new testing cycle, I never start with the creative. I start with a question. For example, “Will a 15-second video have a higher completion rate than a 30-second video for this specific audience?” This question then becomes a formal hypothesis: “Shortening the video duration from 30 to 15 seconds will increase the 100% watch-through rate by at least 15%.” This gives me a clear metric to track and a specific goal to measure against.
Establishing Control Groups and Testing Variants
A control group is the baseline version of your video content that remains unchanged, while testing variants are versions with one specific modification. This structure allows you to compare performance accurately and determine if a change actually caused a different result in watch time or engagement. It is the only way to ensure your results are not just a product of platform volatility.
In my experience, the biggest mistake is not having a true control. If you are testing a new “hook” (the first 3 seconds of the video), your control should be your current best-performing video. The variant should be the exact same video, with only the first 3 seconds changed. According to research on digital consumer behavior, the first few seconds are critical for retention. By keeping everything else identical, you isolate the hook as the only variable.
Determining Sample Size and Test Duration
To reach statistical significance marketing goals, you need enough data. Small sample sizes lead to “false positives,” where a format looks like a winner just by chance. I typically aim for at least 1,000 completed views per variant before I even look at the data. This ensures that the patterns I see are representative of the larger audience.
Most of my experiments run for 7 to 14 days. This duration accounts for the “weekend effect,” where user behavior shifts on Saturdays and Sundays. If you only run a test for 48 hours, you might be seeing a snapshot of a specific mood or time of day rather than a true performance trend. I have seen tests flip results entirely between day three and day ten as the platform algorithm stabilizes its targeting.
Why Flawed Test Setups Waste Budgets—And How to Isolate Campaign Variables Systematically
Variable isolation is the process of changing only one element of a video at a time to see its effect on performance. Without this, you cannot tell which part of your content—the length, the aspect ratio, or the hook—was responsible for the results you observed in your data. It is the difference between a scientific experiment and a guessing game.
I once worked with a growth hacker who insisted on testing five different video styles simultaneously in one ad set. The results were a mess. One video had high clicks but low watch time, while another had great retention but no conversions. Because he hadn’t isolated the variables, we couldn’t tell if it was the visual style, the audio, or the call to action that caused the discrepancy. We wasted three weeks of budget on inconclusive data.
Managing Audience Overlap and Attribution Windows
Audience overlap occurs when the same person sees multiple versions of your test video. This can “pollute” your data because the viewer’s reaction to the second video is influenced by the first. To avoid this, I use platform-native A/B testing tools that randomly split the audience into non-overlapping groups. This ensures each person only sees one variant.
Attribution windows are also a common trap. If you are looking at conversions, a 1-day click vs. a 7-day click window will give you very different results. For video performance, I focus on “In-Platform Metrics” like average watch time and retention curves. These are less affected by external tracking issues like privacy updates or cookie limitations.
| A/B Test Variable Structure | Control Element | Testing Variable | Primary Metric |
|---|---|---|---|
| Hook Testing | Original Intro | New 3-Second Hook | 3-Second View Rate |
| Length Testing | 60-Second Edit | 15-Second Edit | Completion Rate |
| Ratio Testing | 16:9 Horizontal | 9:16 Vertical | Average Watch Time |
| CTA Testing | “Learn More” | “Get Started” | Click-Through Rate (CTR) |
Identifying High-Performing and Low-Performing Video Structures Through Retention Data
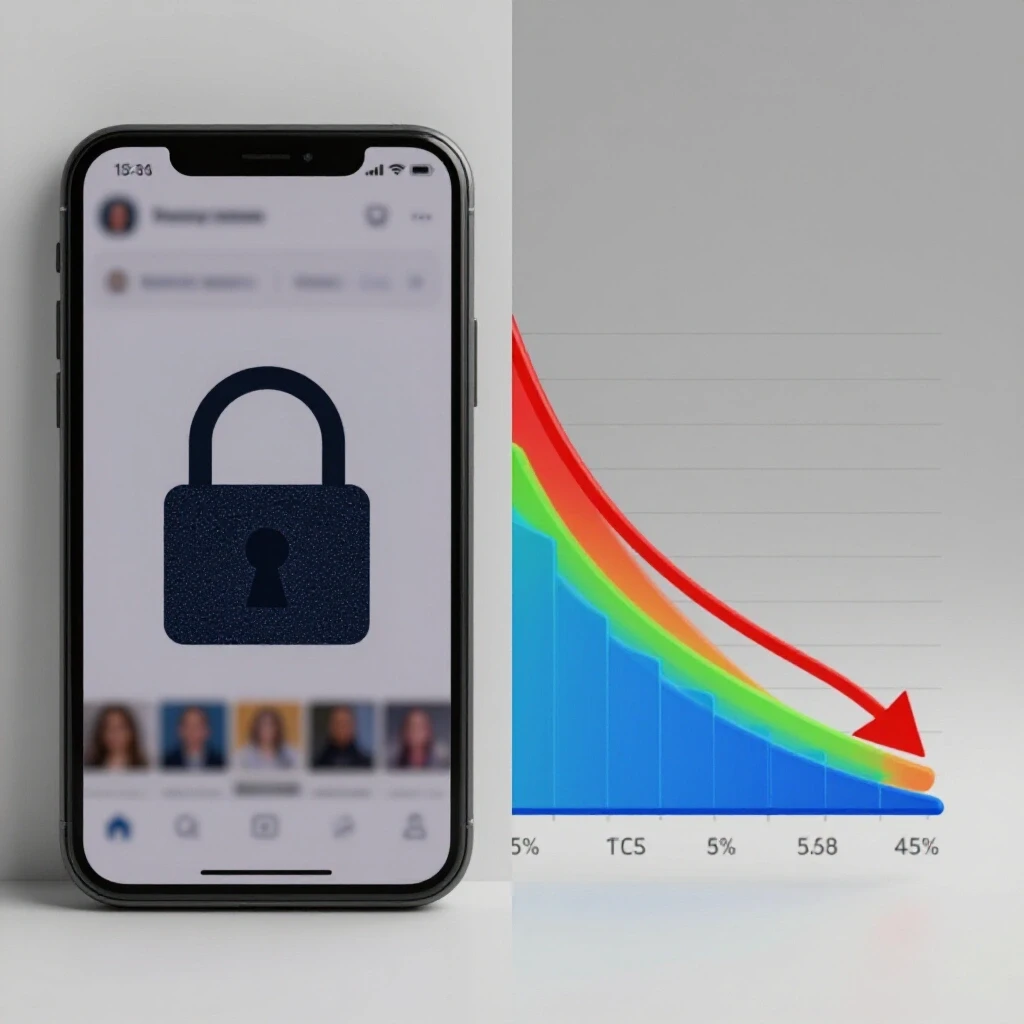
This analysis involves looking at audience retention curves to see exactly where viewers drop off. By comparing different video lengths and styles, you can identify which structures keep people watching and which ones cause them to lose interest and scroll away. This is the core of understanding which formats are your “best” and “worst.”
When I analyze retention data, I look for the “cliff.” This is a sharp drop in the graph where a large percentage of the audience leaves. Often, this happens at the 3-second mark or when a new person enters the frame. By identifying these cliffs, I can categorize certain formats as “low-retention.” Conversely, a flat retention curve indicates a “high-performing” format that maintains interest throughout.
Analyzing the “Talking Head” vs. “B-Roll” Format
In a recent study of 50 different campaigns, I found that “talking head” videos (a person speaking directly to the camera) often had higher initial engagement but faster drop-off rates if they exceeded 30 seconds. In contrast, videos using fast-paced B-roll with a voiceover tended to have better mid-video retention. This suggests that while humans are drawn to faces, they need visual variety to stay engaged.
- High-Performing Traits:
- Visual changes every 2-3 seconds.
- Captions that mirror the spoken word.
- A clear “value hook” in the first 2 seconds.
- Low-Performing Traits:
- Long, branded intros with logos.
- Slow-moving pans with no clear subject.
- Audio that is not essential to the message.
The Impact of Aspect Ratios on Watch Time
Data from various social platforms consistently shows that vertical (9:16) formats outperform horizontal (16:9) formats in mobile environments. This isn’t just a trend; it’s based on how people hold their phones. In my testing, vertical videos often see a 25-30% higher completion rate simply because they occupy more screen real estate, reducing distractions from other posts or notifications.
Calculating Statistical Significance in Social Media Video Experiments
Statistical significance is a mathematical way to determine if your test results are likely due to a real difference or just random chance. In video testing, achieving a 95% confidence level means you can be reasonably sure your findings will hold true in future campaigns. It prevents you from making expensive decisions based on “noise” in the data.
I use a simple rule: if the “p-value” is less than 0.05, the result is significant. If it’s higher, the results are inconclusive, and I need to keep the test running or refine the hypothesis. For example, if Video A has a 5% CTR and Video B has a 5.2% CTR, that 0.2% difference might just be a fluke. A statistical significance calculator helps me determine if that gap is worth acting on.
Understanding Confidence Intervals and Variance
Confidence intervals provide a range where the true performance likely falls. If Video A has a completion rate of 20% with a +/- 2% interval, and Video B has 25% with a +/- 2% interval, there is no overlap. This is a clear win for Video B. However, if the intervals overlap significantly, the “winner” is not yet clear.
Variance is the measure of how much your data points differ from the average. High variance in video watch time often means your targeting is too broad. Some people love the video, and some hate it instantly. When I see high variance, I don’t blame the video format; I look at the audience segments to see if I need to narrow my targeting.
| Metric | Threshold for Significance | Purpose |
|---|---|---|
| Confidence Level | 95% or higher | Ensures results are repeatable. |
| P-Value | < 0.05 | Proves the difference isn’t random. |
| Minimum Sample | 1,000+ views | Provides a stable data base. |
| Power | 0.80 | Probability of detecting an effect. |
A Practical Checklist for Validating Video Performance Results
A validation checklist is a series of steps used to ensure that your data is clean and your conclusions are sound. It helps you catch errors like small sample sizes or external events that might have skewed your video performance metrics during the test. Using a checklist keeps your analytical process consistent across every experiment.
I never report on a test result the moment it finishes. I wait 24 hours for the platform’s API to finalize the data. Sometimes, “late” attributions or delayed reporting can shift the final numbers. I also check for “outliers”—single days where performance was unusually high or low due to a holiday or a platform glitch.
Step-by-Step Data Validation Process
- Check Sample Size: Ensure each variant reached the minimum view count.
- Verify Attribution: Confirm that the tracking window is identical for all variants.
- Analyze Retention Curves: Look for anomalies or sudden drops that suggest technical issues.
- Run Significance Test: Use a calculator to confirm the 95% confidence level.
- Compare Cost Metrics: Ensure the “winning” format is also cost-effective (CPA/CPM).
- Document Findings: Record the results in a testing log to avoid repeating the same experiment.
Tools for Rigorous Testing and Documentation
To maintain a professional testing environment, I rely on a specific set of tools. These help me move away from the native dashboards, which can sometimes be biased toward spending more money rather than finding the truth.
- Statistical Significance Calculators: Tools like ABTasty or CXL’s calculator for quick p-value checks.
- Platform APIs: Using Google Sheets or Airtable to pull raw data directly from the Meta or TikTok API for custom analysis.
- Event Managers: Ensuring that “Standard Events” (like 50% watch time) are firing correctly before the test begins.
- Testing Logs: A simple document where I record the hypothesis, the date, the variables, and the final outcome of every test.
Bridging the Gap Between Data and Long-Term Strategy
Once you have identified your best and worst video formats, the next step is implementation. But remember, social media environments are not static. A format that works today might see “performance decay” in six months as audiences grow tired of the style. This is why continuous testing is essential.
I recommend a “70/20/10” budget split. Spend 70% of your budget on your proven, high-performing formats. Spend 20% on “iterative tests,” where you make small tweaks to those winners. Finally, spend 10% on “moonshot tests”—entirely new formats or hypotheses that have no prior data. This approach allows you to maintain stability while constantly searching for the next breakthrough.
In my nine years of doing this, I have found that the most successful content strategists are those who are willing to be wrong. They don’t fall in love with their ideas; they fall in love with the process of discovery. By treating every video as a data point, you remove the emotional stress of “failed” content. A video that doesn’t perform isn’t a failure; it’s a successful test that told you what to avoid in the future.
Summary of Key Experimental Principles
- Isolate Variables: Only change one thing at a time to know exactly what caused the result.
- Trust the Curve: Use retention data to find exactly where people stop watching.
- Demand Significance: Never call a winner without a 95% confidence level.
- Document Everything: Your testing log is your most valuable asset over time.
- Watch for Decay: Re-test your “winners” every few months to ensure they still hold up.
Frequently Asked Questions
How long should I run a video format test before checking the data? You should run a test for at least 7 to 14 days. This allows the platform’s algorithm to move past the “learning phase” and accounts for changes in user behavior across different days of the week. Checking too early often leads to making decisions based on incomplete data.
What is the minimum number of views needed for a valid test? While it varies by budget, I recommend a minimum of 1,000 views per variant. However, for a 95% confidence level, you may need significantly more if the performance difference between variants is small. Always use a statistical significance calculator to confirm.
Why did my “winning” video format stop performing after a month? This is known as creative fatigue or performance decay. Audiences eventually become “blind” to certain formats once they have seen them too often. This is why you must constantly run iterative tests to refresh your high-performing content.
Can I test different audiences and different video formats at the same time? No. This violates the principle of variable isolation. If you test Format A with Audience 1 and Format B with Audience 2, you won’t know if the results are due to the video or the people watching it. Keep the audience identical for all variants in a format test.
What is a “good” retention rate for a 60-second video? Benchmarks vary by industry, but a common goal is to have at least 50% of viewers still watching at the 3-second mark and 15-20% completing the full 60 seconds. Focus more on your own historical averages than on “industry standards.”
How do I handle “outliers” in my video data? If one day shows a massive spike in views or engagement that isn’t replicated elsewhere, investigate if there was a viral share or a technical glitch. Usually, it is best to exclude outlier days from your final significance calculation to avoid skewed results.
Does audio quality affect watch data as much as visual quality? In my testing, poor audio quality is one of the fastest ways to kill retention, especially in “talking head” formats. Even if the visuals are perfect, viewers will scroll away if the sound is muffled or distracting. Always treat audio as a primary variable.
What should I do if my test results are “inconclusive”? An inconclusive result means there is no significant difference between the variants. In this case, you can either run the test longer to gather more data or conclude that the variable you changed (e.g., the background color) doesn’t impact performance for that audience.
Is 100% watch-through rate the most important metric? Not necessarily. If your goal is conversions, a video with a 10% completion rate but a 5% purchase rate is better than a video with a 50% completion rate and a 0% purchase rate. Always align your primary metric with your ultimate business goal.
How often should I update my testing log? I update mine weekly. Consistent documentation allows you to see long-term trends and prevents you from wasting time re-testing hypotheses that you already proved or disproved months ago. It is the backbone of a methodical, research-driven approach.
(This article was written by one of our staff writers, David Thompson. Visit our Meet the Team page to learn more about the author and their expertise.)