How to Maximize Social Media Ad ROI with Profit First (Case Study)
Managing a multi-million-dollar ad budget over the last decade has taught me one hard lesson. If the profit isn’t in the bank, the return on ad spend (ROAS) on your screen does not matter. I have spent years inside Meta Ads Manager and LinkedIn Campaign Manager trying to find the perfect balance between growth and actual net income.
Early in my career, I focused on scaling spend as fast as possible. I thought a high ROAS meant we were winning. Then, the privacy updates of 2021 hit, and our tracking became a mess. I saw clients with “5x ROAS” in their dashboard who were actually losing money every month. This forced me to change my entire approach to how I handle a multi-channel advertising budget.

I now use a method that prioritizes net gains over vanity metrics. This means looking at the raw data from the bank account alongside the platform data. I have tracked performance across Instagram, TikTok, LinkedIn, Facebook, and X to see which platforms actually drive business value. It is not always the one with the lowest cost-per-click.
Building a Multi-Channel Advertising Budget with Profit in Mind
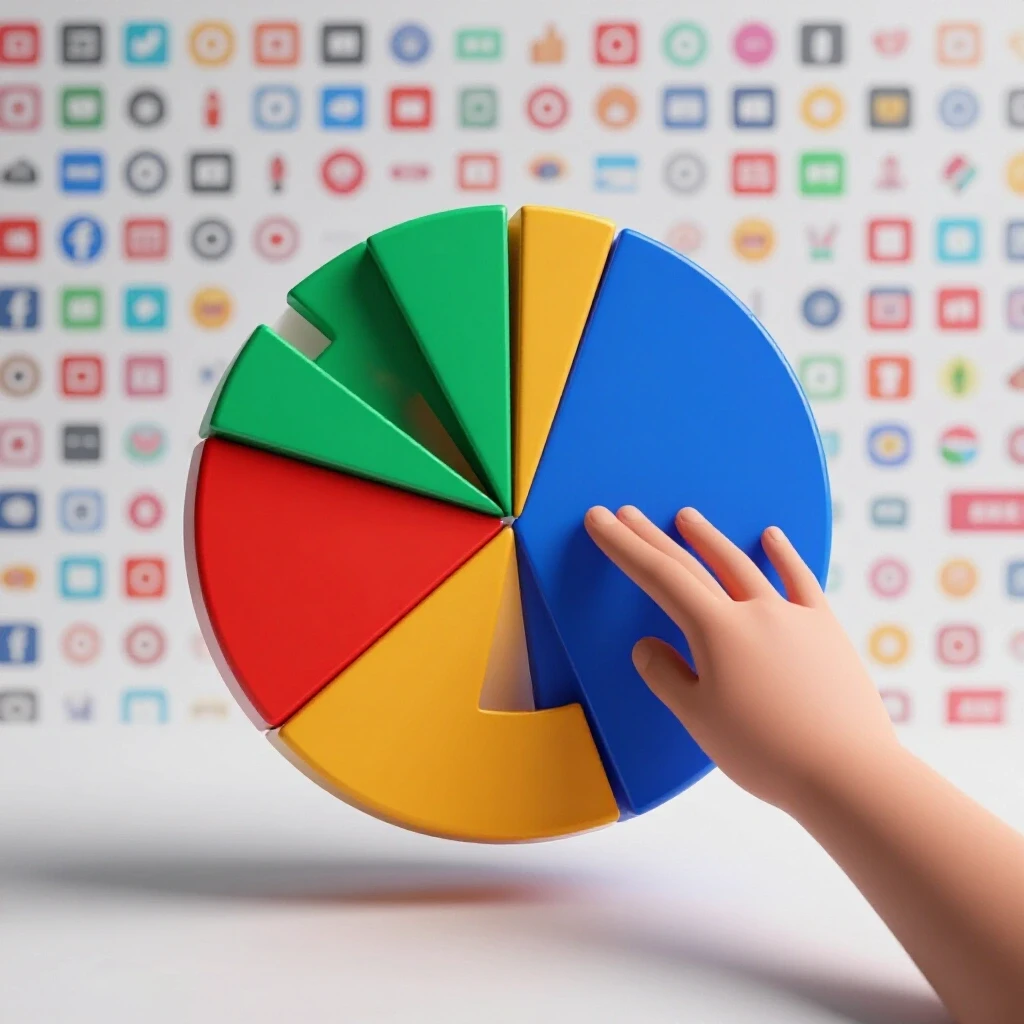
A multi-channel advertising budget is a plan that spreads your money across different social media sites to reach more people. Instead of just looking for clicks, this method focuses on how much actual money stays in your pocket after all the costs are paid. It ensures you do not overspend on one platform.
When I start a new campaign, I follow a specific allocation rule. I put 50% of the money into a core platform that has proven it can deliver sales. I put 30% into a secondary platform to help reach new audiences. The final 20% goes to emerging platforms like TikTok or X to test new ideas. This keeps the account stable while still allowing for growth.
I once managed a high-end clothing brand that put all its money into Instagram. When their costs spiked during the holidays, their profits vanished. We moved 30% of that spend to Pinterest and saw the customer acquisition cost drop by 15%. This taught me that diversification is a safety net for your margins.
You must define your target costs before you turn on any ads. I use a “Break-even ROAS” calculation for every client. If your product costs $50 and your shipping and labor cost $25, you only have $25 left for marketing. If you spend $30 to get a customer, you are losing $5 every time.
Why Fragmented Platform Data Skews Social Media Ad ROI
Social media ad ROI is a measure of how much money you make compared to how much you spend on ads. Because every platform tracks users differently, the numbers often do not match up. This can lead to “double counting” where two different platforms both claim credit for the same sale.
| Platform | Typical Attribution Window | Primary Strength | Tracking Reliability |
|---|---|---|---|
| Meta (FB/IG) | 7-day click, 1-day view | Visual discovery | Moderate (CAPI helps) |
| 30-day click, 7-day view | B2B targeting | High for lead gen | |
| TikTok | 7-day click, 1-day view | Viral reach | Low (Browser-based) |
| Google Search | 30-day click | High intent | High |
I have seen cases where Meta claimed 100 sales and Google claimed 80, but the store only had 120 total orders. This happens because a user might click a Facebook ad, then later search for the brand on Google. Both platforms want to look good, so they both take credit. This is why you cannot trust a single dashboard.
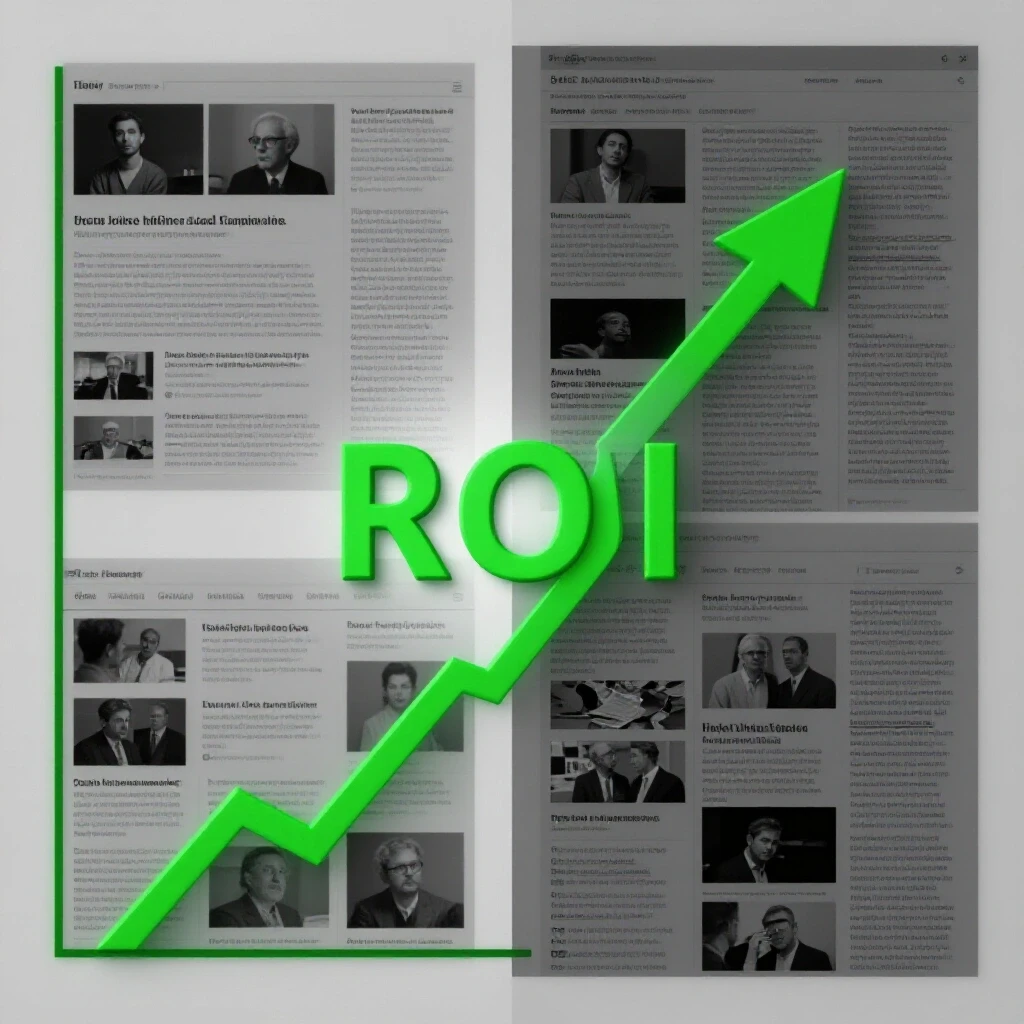
To fix this, I look at the “Blended ROAS” or Marketing Efficiency Ratio (MER). This is your total revenue divided by your total ad spend across all channels. It is the only number that cannot be faked. If your MER is going up, your business is getting healthier, regardless of what TikTok tells you.
Implementing a Robust ROI Tracking Framework
An ROI tracking framework is a set of tools and rules used to see which ads are making money. It combines platform data with outside tracking tools to get a clearer picture of the customer journey. This helps managers decide where to put more money and where to cut spend.
I recommend a three-layer tracking system for any serious ad account. First, use the platform’s native pixel and Conversion API (CAPI). This sends data directly from your server to the platform, which bypasses some ad blockers. Second, use UTM parameters on every single link so you can see the source in Google Analytics.
Third, I use a post-purchase survey. I ask customers, “How did you first hear about us?” Interestingly, many people say they saw us on a platform that didn’t even show a click in our dashboard. This “dark social” data is vital for understanding your cross-platform performance.
- Set up Meta Conversions API to recover lost signal.
- Use a standard UTM naming convention (Source, Medium, Campaign).
- Review your “View-Through” conversions separately from “Click-Through” sales.
- Audit your tracking codes every 14 days to ensure no breaks occurred.
Managing Customer Acquisition Cost Across Diverse Platforms
Customer acquisition cost (CAC) is the total amount of money you spend to get one new customer. It includes the ad spend, the creative costs, and the management fees. Keeping this number lower than the profit from a single sale is the key to staying in business.
In my experience, LinkedIn often has the highest CAC, but the customers usually spend more money over time. TikTok often has a very low CAC, but the customers might only buy once. You have to balance these different behaviors to keep your cash flow steady. I use a 7-to-14-day attribution check to see how these costs trend over time.
I managed a software company that was worried about their $200 CAC on LinkedIn. They wanted to switch to Facebook where the CAC was only $50. However, when we looked at the data, the LinkedIn customers stayed for two years, while the Facebook customers quit after two months. The “expensive” lead was actually more profitable.
Ad Spend Justification for Executive Stakeholders
Ad spend justification is the process of proving to a boss or client that marketing money is being used wisely. It involves showing how ad dollars turn into profit, not just likes or views. This requires clear reports that connect marketing metrics to the company’s bottom line.
When I present to a board, I avoid talking about “CTR” or “Engagement Rate.” They don’t care about those. I talk about “Contribution Margin” and “Payback Period.” I show them how much spend we can add before the profit per customer starts to drop. This builds trust because it shows I am thinking like a business owner.
I once had a client who wanted to cut the budget by 50% because they felt the ads weren’t “working.” I showed them a chart of their “Blended CAC” vs. their “Organic Baseline.” I proved that when we stopped ads in one region, their organic sales there dropped by 20%. This proved the ads were assisting sales even if they didn’t get the final click.
- Focus on “Net Profit After Ad Spend” in every report.
- Show the “Incrementality” of your ads (sales you wouldn’t have had otherwise).
- Compare current performance to the same month in the previous year.
- Explain the “Halo Effect” where social ads drive more search traffic.
Optimizing Cross-Platform Performance Through Lean Testing
Lean testing is a way to try out new ad ideas with a small amount of money before spending a lot. This helps you find the best creative and targeting without wasting your budget. It is a scientific approach to finding what your audience likes the most.
I never launch a huge campaign without testing the “hooks” first. I might spend $500 on four different videos to see which one gets the most “Thumb-Stop” views. Once I find a winner, I move it to the main campaign and increase the budget. This prevents “budget-blowing” spikes where you spend thousands on an ad that no one likes.
I use a “Creative Matrix” to track which styles work on which platforms. A fast-paced, lo-fi video might do great on TikTok but fail on LinkedIn. A professional, text-heavy image might win on LinkedIn but get ignored on Instagram. Matching the creative to the platform’s user behavior is essential for a high social media ad ROI.
Resolving Platform Attribution Gaps with First-Party Data
First-party data is information that you own, like your email list or customer purchase history. Using this data helps fill in the gaps when platforms like Meta or Google cannot see who bought a product. It is the most reliable way to track long-term customer value.
Since the recent privacy changes, I rely heavily on “offline conversions.” I upload my list of actual sales back into the ad platforms. This tells the algorithm exactly who the buyers are, even if their iPhone blocked the tracking pixel. This feedback loop is what allows the AI to find more people like your best customers.
I worked with a B2B brand that struggled with a long sales cycle. It took six months for a lead to become a customer. By the time the sale happened, the ad platform had forgotten the original click. We started using a CRM integration to send that sale data back to LinkedIn. Our “cost per high-value lead” dropped by 40% because the platform finally knew what a “good” lead looked like.
Practical Tools for Performance Tracking
To manage these complex budgets, you need the right tools. I don’t rely on just one. I use a combination of spreadsheets and software to keep the data clean.
- Triple Whale or Northbeam: These tools help with multi-touch attribution and show a “true” ROAS.
- Google Looker Studio: I use this to build custom dashboards that combine data from every platform.
- Supermetrics: This pulls data from ad managers directly into my spreadsheets for deep analysis.
- ProfitWell: This is great for tracking the lifetime value of customers in subscription businesses.
- Slack Alerts: I set up automated alerts to tell me if a campaign’s CPA goes 20% above our target.
Final Steps for Profit-Led Ad Management
If you want to move toward a more profitable ad strategy, start small. First, calculate your true break-even point for every product. Next, set up a simple spreadsheet to track your total daily spend against your total daily revenue. This will give you your Blended ROAS immediately.
Stop looking at the 1-day or 7-day windows in isolation. Look at the trends over several weeks. If your spend is going up but your bank balance is staying the same, you are just making the ad platforms rich. Be brave enough to turn off “winning” ads if they aren’t actually helping the business grow.
Managing ads is not just about being creative. It is about being a good steward of the company’s money. When you treat every dollar like it’s your own, your decision-making becomes much sharper. You stop chasing “likes” and start chasing “margins.”
Frequently Asked Questions
How do I calculate my blended ROAS? To find your blended ROAS, take your total revenue from all sources and divide it by your total ad spend across all platforms. For example, if you made $10,000 and spent $2,000 on ads, your blended ROAS is 5.0. This gives you the most honest view of your marketing health.
What is a good target for customer acquisition cost? A good CAC depends on your product price and customer lifetime value. Generally, you want your CAC to be at least three times less than the total money a customer spends with you over time. If a customer spends $300, you should try to keep your CAC under $100.
Why does Meta show more sales than my Shopify store actually received? This usually happens because of “view-through” attribution. Meta counts a sale if someone saw your ad and then bought something within 24 hours, even if they didn’t click. If that person also clicked a Google ad, both platforms will claim the sale, leading to inflated numbers.
How much of my budget should go to testing new platforms? I recommend the 70/20/10 rule or the 50/30/20 rule. Put the majority into what is working now. Put a smaller portion into secondary channels. Keep about 10% to 20% for “experimental” spend where you try new platforms or wild creative ideas.
What is the best way to track ads after the iOS privacy updates? The best way is to use a “server-side” tracking method like the Meta Conversions API. This sends data directly from your website’s server to the ad platform. It is much more reliable than the old “browser-based” pixels that can be blocked by many devices.
How often should I change my ad creative? You should change your creative when you see your “frequency” get too high or your “CTR” start to drop. In high-spend accounts, this might be every week. In smaller accounts, your ads might last for a month or more before people get tired of seeing them.
Should I bid for “lowest cost” or “cost cap”? If you are just starting, “lowest cost” is usually best to get data. Once you know your target CAC, use “cost caps” to prevent the platform from overspending on expensive leads. This helps protect your profit margins during competitive times like Black Friday.
What is the difference between ROAS and ROI in advertising? ROAS only looks at the revenue generated per dollar of ad spend. ROI looks at the total profit after all costs, including the cost of the goods sold, shipping, and labor. You can have a high ROAS but a negative ROI if your margins are too thin.
How do I know if a new platform is worth the investment? Look at the “intent” of the users. If you sell a visual product, Instagram or TikTok is likely worth it. If you sell a professional service, LinkedIn is better. Run a small test for 30 days and measure the “cost per lead” against your existing channels.
Can I trust the “Suggested Budget” in Ads Manager? No. Ad platforms are designed to make money for the platform. Their suggested budgets are often higher than what is needed for maximum profit. Always set your budget based on your own financial goals and your break-even math, not the platform’s suggestions.
What is “dark social” and how does it affect my ROI? Dark social refers to people sharing links in private ways, like text messages or emails, which platforms cannot track. This makes it look like a sale came from “Direct” traffic when it actually came from an ad. Post-purchase surveys are the best way to uncover this hidden ROI.
How do I justify a rising CAC to my stakeholders? Show them the “Lifetime Value” (LTV) of the customers you are getting. If the cost to get a customer is going up, but those customers are buying more often or staying longer, the higher CAC is justified. Always frame the conversation around long-term profit, not just the initial sale.
(This article was written by one of our staff writers, James Harrington. Visit our Meet the Team page to learn more about the author and their expertise.)