How to Build a Content Strategy That Matches Social Media Demand (Guide)
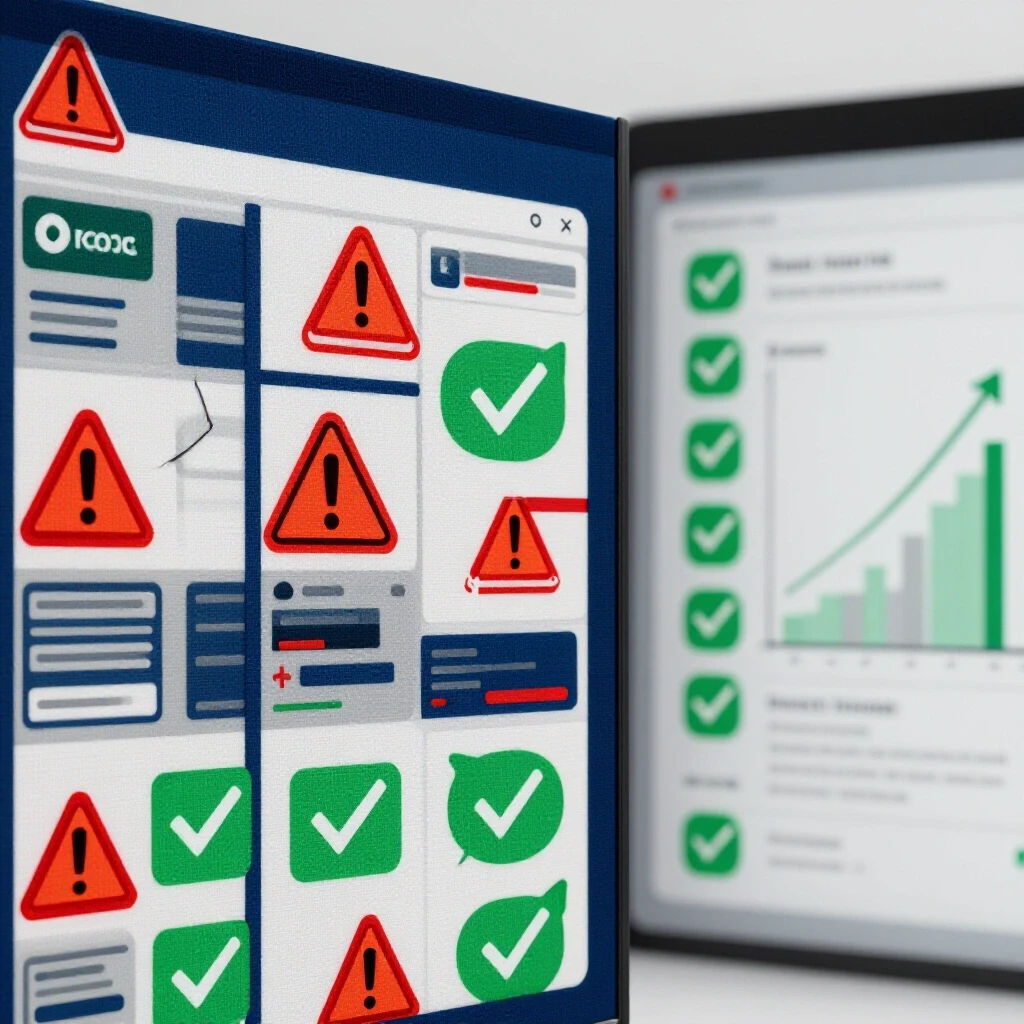
Imagine two different campaign dashboards. On the left, a brand posts three times a day, every day, yet their reach has declined by 14% month-over-month. On the right, a brand posts only four times a week, but their engagement velocity is climbing and their cost-per-acquisition is dropping. The difference isn’t luck; it is the result of a deliberate shift toward aligning creative output with actual audience signals.
In my 11 years as a social media strategist, I have managed over 40 account growth journeys. I have seen campaigns thrive and I have seen them stall. Most stagnation happens because a brand is producing content based on a calendar rather than based on what the platform data is telling them. When I track a campaign lifecycle, I look for the moment where production volume finally meets the specific format and topic demand of the target audience.
Setting the Foundation for Data-Responsive Social Media Campaigns
This phase involves establishing baseline metrics and growth forecasting to ensure every post has a measurable purpose. It requires looking at historical performance to set realistic expectations for reach, engagement, and conversion before a single ad dollar is spent or a single video is filmed.
Before you can align your output with audience needs, you must know your starting point. I define a baseline engagement rate by averaging the performance of the last 30 days of organic posts. For Instagram, a healthy baseline often sits between 1% and 3%, while TikTok can vary wildly between 4% and 10% depending on the niche.
Growth forecasting is not about guessing. It is about looking at platform-native analytics to see how many people your content currently reaches and how many of those people actually convert into followers or customers. I use a simple spreadsheet to track “Reach-to-Follower” ratios. If you reach 10,000 people but only gain 10 followers, your content is reaching people, but it is not meeting their specific interests or needs.
Defining Baseline Metrics and Growth Benchmarks
Benchmarks provide the “ground truth” for any social media growth strategy. They allow you to see through the noise of viral spikes and understand the steady-state health of an account. Without these numbers, you cannot tell if a strategic pivot is actually working or if you are just seeing a temporary trend.
I recommend a minimum observation period of 14 to 30 days before making any major changes. During this time, I track three primary metrics: – Engagement Velocity: How fast a post gains likes, comments, and shares in the first two hours. – Audience Retention: The percentage of viewers who watch a video past the 3-second and 10-second marks. – Follower Conversion Rate: The percentage of profile visitors who click the “follow” button.
Target Platform Selection and Content-Format Fit
Not every platform requires the same type of creative energy. Choosing where to focus depends on where your audience signals are strongest. I often see marketers fail because they try to force a LinkedIn-style professional post into a TikTok environment without adjusting the “hook” or the visual pacing.
Platform-native retention rules dictate success. On TikTok, the first 1.5 seconds are critical for stopping the scroll. On LinkedIn, the first two lines of text act as the hook. Identifying which platform is giving you the best “return on effort” is the first step in creating a performance-aligned content framework.
Diagnosing Stagnation: When Your Creative No Longer Meets Audience Interest
Stagnation is a signal that your current content model has reached its ceiling or the algorithm has shifted its weight toward different formats. It is characterized by flatlining follower counts and a steady decrease in organic reach despite consistent posting schedules and high-quality production.
I recently managed an account for a mid-sized lifestyle brand. For six months, they saw steady growth using high-production Reels. Suddenly, their reach dropped by 40%. The metrics showed that while people were seeing the videos, they were scrolling past them faster than before. The “demand” had shifted from polished, aspirational content to raw, behind-the-scenes “vlog” style updates.
Why Sudden Stagnation Halts Growth Journeys
Algorithms on platforms like Instagram and TikTok are designed to maximize user time-on-app. If your content no longer keeps people watching, the platform will stop showing it to new audiences. This creates a feedback loop where low engagement leads to lower reach, which eventually leads to total stagnation.
Stagnation often occurs when a strategist ignores “creative fatigue.” This happens when an audience has seen a specific style of post so many times that they no longer find it valuable. Recognizing this early allows you to pivot before you waste months of production time and ad spend on concepts that no longer resonate.
Pivot Trigger Analysis: When to Change Course
A pivot should never be based on a “gut feeling.” I use a Pivot Trigger Analysis table to decide when it is time to change the strategy. If reach stays 20% below the 30-day average for more than two weeks, it is a clear signal that the current approach is failing to meet audience demand.
| Metric | Warning Sign (Yellow Flag) | Pivot Trigger (Red Flag) |
|---|---|---|
| Organic Reach | 10% decline over 7 days | 20% decline over 14 days |
| Engagement Rate | 1% drop below baseline | 2.5% drop below baseline |
| Video Retention | < 20% watch-through at 3s | < 10% watch-through at 3s |
| Ad CTR | 0.5% below industry average | 1.0% below industry average |
The Pivot Framework: Realigning Production with Engagement Velocity
This framework is a step-by-step process for shifting your content strategy once you have identified a mismatch between what you are posting and what your audience wants. It involves pausing low-performing formats and reallocating resources toward high-signal content types.
When I execute a pivot, I don’t change everything at once. I start by identifying the “outliers”—those rare posts that performed significantly better than the average. I then deconstruct why they worked. Was it the topic? The visual style? The time of day? This data-backed approach reduces the risk of the pivot and helps justify the change to clients.
Step 1: Auditing High-Signal Content
Look back at your last 90 days of posts. Filter them by “Shares” and “Saves” rather than just “Likes.” Shares and saves are higher-intent signals that indicate your content provided actual value or sparked a reaction. These are the formats you should lean into during your pivot.
Step 2: Testing New Formats with the 70/20/10 Rule
To manage risk, I allocate my content production and ad spend using a specific split. This ensures the majority of the work stays within proven territory while still allowing for the innovation needed to find new growth.
- 70% Core Content: Formats and topics that have historically met audience demand and provide steady reach.
- 20% Experimental Content: New formats (e.g., shifting from static images to carousels) based on recent platform trends.
- 10% High-Risk Content: Completely new ideas or “wildcard” topics that could fail but offer high reward if they go viral.
Budget Allocation and Risk Management in Multi-Platform Growth
Managing paid social spend requires a balance between scaling what works and testing new creative concepts. This section covers how to distribute funds across Instagram, TikTok, and LinkedIn to ensure you are not wasting money on unproven content ideas.
In my experience, the biggest waste of ad spend happens when a brand puts money behind a post that is already failing organically. I use a “proven-first” model. A post must meet a certain organic engagement threshold before it is moved into a paid campaign. This ensures that the paid reach is amplifying a message that people actually want to see.
Campaign Milestone Timelines
A successful growth journey follows a predictable timeline of testing, learning, and scaling. By following these milestones, you can manage client expectations and avoid the “panic pivot” that often happens when results aren’t immediate.
- Days 1–7 (Baseline Testing): Run organic content and low-budget ads to gather initial data on CTR and retention.
- Days 8–14 (Signal Identification): Identify which 20% of content is driving 80% of the results.
- Days 15–21 (Strategic Pivot): Shift budget and production away from low-performers and toward high-signal formats.
- Days 22–30 (Scaling): Increase spend on the winning creative and monitor for fatigue.
Minimum Observation Periods for Paid Ads
Never turn off an ad after 24 hours. Most platform algorithms, especially Meta’s, require a “learning phase” to understand who is most likely to engage with your content. I recommend a minimum of 7 days for any paid test. This allows the system to normalize for daily fluctuations in user behavior, such as the difference between a Monday morning and a Saturday night.
Platform-Specific Retention Rules and Algorithmic Weighting
Each platform uses different signals to determine which content to promote. Understanding these weights allows you to tailor your content to the specific “demand” of each algorithm, whether it is the fast-paced loop of TikTok or the professional depth of LinkedIn.
According to Pew Research, digital engagement trends show that users are increasingly looking for “utility” on LinkedIn and “entertainment” on TikTok. If your LinkedIn strategy is too focused on entertainment without providing professional value, the algorithm will likely deprioritize your posts over time because they don’t align with why users are on that specific platform.
TikTok: The Critical First Three Seconds
TikTok is a high-volume, high-velocity platform. The algorithm weights “completion rate” and “rewatches” very highly. If your video is 30 seconds long but people drop off at 5 seconds, your reach will be capped. To match demand here, your content must be paced quickly, with a new visual or auditory hook every few seconds.
LinkedIn: Dwell Time and Meaningful Comments
LinkedIn prioritizes “dwell time”—the amount of time a user spends looking at your post. Long-form text posts and PDF carousels are excellent for this. Furthermore, a comment that starts a conversation is worth much more than a simple “Great post!” reaction. To succeed here, your content must invite detailed responses from industry peers.
Communicating Strategic Changes to Stakeholders Using Data Logs
One of the hardest parts of being a strategist is explaining to a client or a manager why you are changing a strategy they previously approved. Using a transparent data log makes these conversations objective rather than personal.
I use a “Transition Log” to document every change made to a campaign. This log includes the date of the change, the data that triggered the change, and the expected outcome. When I show a client that we are pivoting because our 3-second retention dropped by 15%, they are much more likely to support the decision than if I simply say “I think we should try something new.”
Creating a Pivot Report Template
A good pivot report should be concise and visual. It should answer three questions: 1. What happened? (e.g., Organic reach dropped by 20% over two weeks.) 2. Why did it happen? (e.g., Competitor volume increased, or our creative style became fatigued.) 3. What are we doing about it? (e.g., Reallocating 20% of the budget to test a new “vlog” format.)
Using Meta Transparency Reports and Industry Benchmarks
Always back your decisions with external data. Meta’s advertising transparency reports and independent studies on digital engagement provide a broader context for your account’s performance. If the entire industry is seeing a drop in reach due to a platform update, it is easier to explain that your stagnation is part of a larger trend, not a failure of your specific creative.
Best Practices for Maintaining Long-Term Growth
- Audit your creative every 14 days. Don’t wait for a total collapse in reach to look at your metrics.
- Prioritize “Saveable” and “Shareable” metrics. These are the strongest indicators that your content is meeting audience demand.
- Maintain a 10% “R&D” budget. Always be testing something new so you have a backup plan if your primary strategy fails.
- Use platform-native tools for editing. Platforms like TikTok often give a slight algorithmic preference to videos edited using their in-app tools and trending sounds.
- Don’t ignore the comments. The comments section is a goldmine for “demand signals.” If five people ask the same question, that is your next content topic.
Common Rookie Mistakes to Avoid
Many marketers make the mistake of “panic posting” when reach drops. They start posting more frequently, which often leads to lower quality and further irritates the algorithm. Another common error is copying a competitor’s viral hit without understanding if that format fits their own audience’s specific needs.
Finally, avoid the “set it and forget it” mentality with paid ads. Even the best-performing ad will eventually hit a fatigue point where the cost-per-result starts to climb. Successful campaign lifecycle management requires constant monitoring and a willingness to kill your “darlings” if the data shows they are no longer working.
Project Management and Analytics Tools
To stay organized and data-driven, I rely on a specific stack of tools: 1. Metric Dashboards: Tools like Looker Studio or native platform insights to track weekly trends. 2. Scheduling Apps: Buffer or Later to maintain consistency without manual posting. 3. Content Logs: A simple Notion or Google Sheets database to track every post’s “Hook,” “Format,” and “Performance.” 4. Creative Briefs: Standardized templates to ensure every new experiment has a clear hypothesis.
By following this structured approach, you move away from the stress of unpredictable algorithm shifts and toward a model of sustainable, data-backed growth. You become a strategist who doesn’t just “post content,” but one who carefully aligns every creative decision with the observable demands of the audience.
Frequently Asked Questions
How do I know if my content is stagnant or if it’s just a bad week? Stagnation is defined by a consistent trend over at least 14 days. A “bad week” can happen due to holidays, major news events, or temporary platform glitches. If your reach and engagement remain 20% below your 30-day average for two full weeks, it is time to analyze your strategy for a pivot.
What is a “good” CTR for social media ads? While it varies by industry, an average Click-Through Rate (CTR) for Facebook and Instagram ads is typically between 0.9% and 1.3%. If your CTR is below 0.5%, your creative is likely not matching the demand or interest of the audience you are targeting.
How much of my budget should I spend on testing new ideas? I recommend the 70/20/10 rule. Spend 70% of your budget on proven content, 20% on variations of what works, and 10% on completely new, high-risk concepts. This protects your baseline while allowing for the discovery of new growth drivers.
Should I delete low-performing posts? Generally, no. Low-performing posts provide valuable data on what not to do. Deleting them doesn’t “fix” your algorithm standing. Instead, use the data from those posts to inform your next pivot. The only exception is if the content is factually incorrect or damaging to the brand.
How long does the “learning phase” last for new ads? Most platforms require about 50 conversion events (like clicks or purchases) within a 7-day period to exit the learning phase. During this time, performance can be volatile. Avoid making any major changes to the ad set until this phase is complete.
How do I justify a strategy pivot to a client who likes the current (but failing) content? Use a Transition Log. Show them the specific metrics—like a drop in audience retention or an increase in cost-per-lead—and present the pivot as a data-backed experiment rather than a permanent change. Frame it as “optimizing for better ROI.”
What is the most important metric for organic growth on TikTok? The “Watch Time” and “Completion Rate” are the most critical. If users are not watching your video until the end, the algorithm will not push it to the “For You” page. Focus on your first 3 seconds to ensure people don’t scroll past.
Can I use the same content for Instagram and LinkedIn? You can, but you must “re-package” it. A video that works as a Reel may need a more professional, context-heavy caption for LinkedIn. The audience on LinkedIn expects more “why” and “how,” whereas the Instagram audience often prefers the “what” and the visual experience.
How often should I check my analytics? For daily management, a quick check is fine, but you should do a deep-dive analysis once a week. This allows you to see patterns without getting distracted by the daily “noise” of social media fluctuations.
What should I do if a pivot fails? If a pivot doesn’t improve your metrics after 14 days, go back to your last “stable” state and try a different experimental direction. This is why the 10% high-risk budget is important—it allows you to fail small without crashing the entire account.
(This article was written by one of our staff writers, Michael Reynolds. Visit our Meet the Team page to learn more about the author and their expertise.)