How to Build an Effective Social Media Funnel (Proven Steps)
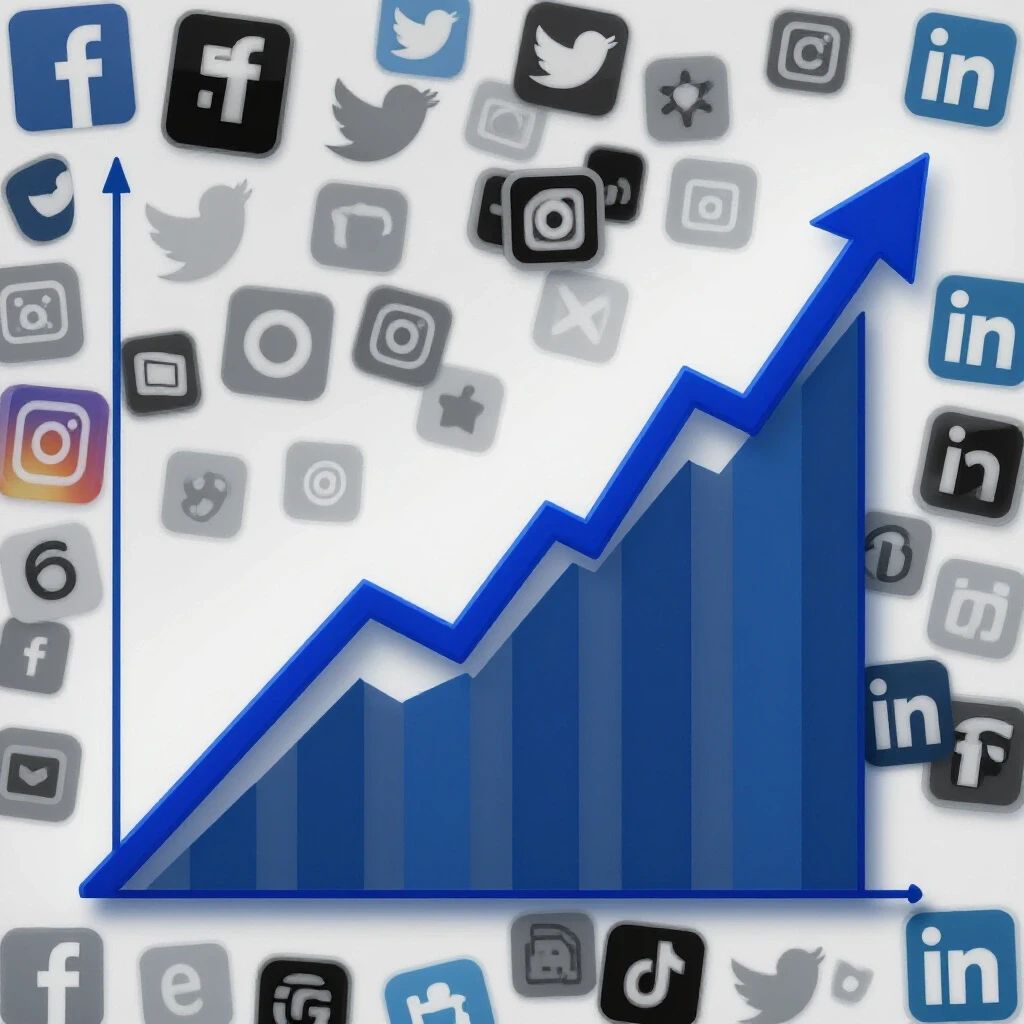
Building a sustainable system for social media growth does not have to feel like a full-time job of manual labor. After 11 years of tracking the lifecycles of more than 40 account growth journeys, I have learned that the most effective systems are those that allow for ease of maintenance. When I first started, I would spend hours reacting to every minor dip in engagement. Now, I rely on a structured framework that bridges the gap between organic discovery and paid conversion. This approach allows me to manage multi-platform accounts on Instagram, TikTok, and LinkedIn without feeling overwhelmed by every algorithm shift.
Developing a Framework for Social Media Growth Strategy
A growth strategy is a documented plan used to increase account visibility and engagement through a mix of organic content and targeted paid spend. It serves as the foundation for how a brand shows up online and interacts with its community.
In my experience, the biggest mistake marketers make is launching without a baseline. Before I start any new campaign, I spend 14 to 30 days observing current performance. This period helps me understand the baseline engagement rate, which is the percentage of your followers who interact with your posts. Without this number, you cannot know if your new strategy is actually working. I have seen campaigns that looked like failures but were actually performing 20% above the account’s historical average.
Setting a baseline also involves platform selection. According to Pew Research Center data, audience demographics vary wildly between platforms. If I am working with a client targeting professionals, LinkedIn is the priority. If the goal is rapid, trend-based reach, TikTok takes the lead. I track these decisions in a central log to justify why we are spending time on one platform over another. This transparency helps when a client asks why we aren’t “viral” on a platform that doesn’t fit their audience.
Designing the Multi-Platform Organic Growth Layer
Multi-platform organic growth requires understanding how different apps distribute content. On TikTok, the algorithm favors high watch time and “loopability.” On Instagram, the focus has shifted heavily toward Reels to compete with TikTok, but saves and shares are the metrics that signal true value to the system. LinkedIn, meanwhile, prioritizes dwell time—how long someone stays on your post—and the depth of the comments.
I use a specific content sequencing method. I might post a raw, behind-the-scenes video on TikTok to test a concept. If it performs well, I polish it for an Instagram Reel. If the comments show people are asking deep questions, I turn those questions into a long-form text post for LinkedIn. This “recycle and refine” method ensures I am not starting from zero on every app. It also provides a safety net; if Instagram reach drops suddenly, my LinkedIn presence often remains stable.
Implementing Campaign Lifecycle Management and Paid Integration
This is the process of tracking a campaign from its first post to its final report, ensuring budget is spent efficiently as the audience moves from awareness to action. It involves moving beyond just “posting” to actively managing how users move through your content.
I follow a strict budget allocation split to manage risk. I call this the 70/20/10 rule: * 70% of the budget goes to core, proven content that I know resonates with the audience. * 20% goes to experimental variations, like testing a new video style or a different hook. * 10% is reserved for high-risk, high-reward ideas that might fail but could offer a breakthrough.
This split prevents the fear of wasting ad spend. If a high-risk idea flops, it only represents 10% of the budget. Interestingly, some of my biggest breakthroughs in my 40+ account journeys came from that 10% bucket. For example, I once tested a very low-production, “ugly” ad creative on Instagram that ended up outperforming our high-budget studio videos by 300% in terms of click-through rate (CTR).
Understanding Algorithmic Reach Distribution
Algorithmic reach distribution is the way a platform decides how many people see your post based on initial engagement signals. It is not a random process, but a weighted calculation.
When you post, the platform shows your content to a small “test group.” If that group engages, the circle widens. If they scroll past, the reach is throttled. I have found that the first 60 minutes are critical on Instagram, while TikTok can sometimes “slow burn,” with a video gaining traction three days after it was posted. Knowing this prevents me from panicking and deleting a post too early.
Why Sudden Stagnation Halts Growth Journeys
Stagnation happens when reach stops growing despite consistent posting; a pivot blueprint is the data-backed plan to change direction without losing progress. It is a common pain point for marketers managing multiple accounts.
I have managed several accounts where growth suddenly flatlined. Often, this is due to “ad creative fatigue,” which is when your audience has seen your content too many times and stops responding. To combat this, I monitor the frequency metric in ad managers. If frequency climbs above 3.0 while CTR drops, it is a clear sign that the audience is tired of the visuals.
When stagnation hits, I use a Pivot Trigger Analysis. This is a simple table I share with clients to justify a change in strategy. It shows the specific metrics that have dropped and the proposed tactical shift.
Pivot Trigger Analysis Table
| Metric Signal | Threshold for Concern | Action/Pivot |
|---|---|---|
| Organic Reach | 30% drop over 14 days | Shift content format (e.g., Video to Carousel) |
| Ad CTR (Click-Through Rate) | Below 0.8% on Instagram | Refresh creative assets immediately |
| Engagement Rate | Below 2% of total followers | Audit audience alignment and hashtags |
| Follower Growth | Negative for 7 consecutive days | Launch a targeted “Value-First” organic series |
Utilizing Lookalike Audience Sources and Retargeting
Lookalike audience sources are groups of people created by platform AI who share similar characteristics with your existing customers. Retargeting is the practice of showing ads specifically to people who have already interacted with your organic content.
This is where the transition from organic to paid becomes powerful. I don’t just run ads to “everyone.” I build audiences based on people who watched at least 50% of my organic videos. These are “warm” leads. Because they have already seen my face or brand in their feed, the cost per click is usually much lower.
In one project, we saw a 40% reduction in ad costs by switching from broad targeting to retargeting organic video viewers. This data makes it very easy to justify a pivot to management. You aren’t just “trying something new”; you are optimizing based on proven interest.
Establishing Marketing Trend Analysis and Post-Campaign Reviews
Marketing trend analysis is the habit of looking at long-term data patterns rather than daily fluctuations to make strategic decisions. It requires a “big picture” view of your account’s health.
After every campaign, I conduct a retrospective performance matrix. I look at what worked, what failed, and—most importantly—why. I use several tools to keep this data organized:
- Platform-Native Analytics: I export raw data from Instagram Insights and TikTok Creator Center.
- Custom KPI Dashboards: A simple spreadsheet where I track weekly growth across all platforms.
- Ad Transparency Reports: I check Meta’s Advertising Transparency tools to see what competitors are doing, which helps me benchmark our CTRs.
- Content Scheduling Apps: Tools like Later or Sprout Social help me visualize the content mix and ensure we aren’t over-posting one specific type.
By reviewing these every 30 days, I can spot “algorithmic adaptation.” This is when a platform changes its rules—like when LinkedIn reduced the reach of posts containing external links. Because I was tracking the data, I noticed the drop in 48 hours and adjusted our strategy to put links in the first comment instead.
Actionable Benchmarks for Sustainable Growth
To keep a campaign on track, you need clear markers of success. These are not guesses; they are industry-standard figures adjusted for your specific niche.
- Minimum Observation Period: Never judge a strategy change in less than 14 days. Platforms need time to learn.
- Acceptable Variance: A 10-15% fluctuation in weekly reach is normal. Do not pivot unless the drop is sustained for two weeks.
- Baseline Engagement: For most brands, an organic engagement rate of 1% to 3% is healthy.
- Ad Creative Refresh: Plan to update your paid visuals every 21 to 30 days to avoid fatigue.
When I present these to clients, it lowers their anxiety. They stop looking at the daily “likes” and start looking at the 30-day trendline. This shift in perspective is what allows a social media strategist to move from a “task-doer” to a “growth consultant.”
Navigating Platform Reach Recovery
Platform reach recovery is the strategic process of regained lost visibility after an algorithm update or a period of account inactivity. It is a slow process that requires patience and data.
If an account’s reach has tanked, I don’t suggest spending more money on ads immediately. Instead, I go back to basics. I look at the top-performing posts from the last six months and recreate them with a modern twist. I also increase engagement with other accounts in the same niche. This signals to the algorithm that the account is active and relevant again.
I once managed a LinkedIn account that lost 50% of its reach after the owner stopped posting for a month. We recovered the reach by posting daily “value-only” text posts for three weeks—no links, no sales pitches. Once the engagement returned to the baseline, we reintroduced the promotional elements of the funnel.
Conclusion and Next Steps
Building a reliable system for social media growth is about managing uncertainty with data. By setting baselines, using a 70/20/10 budget split, and monitoring pivot triggers, you can protect your ad spend and your sanity. The most important thing is to start documenting your own “transition logs.” Every time you change a strategy, write down why you did it and what the result was 14 days later. Over time, this becomes your own private playbook for success.
For your next campaign, try these three steps: 1. Identify your baseline engagement rate from the last 30 days. 2. Set a “Pivot Trigger” (e.g., “If CTR stays below 0.8% for 7 days, I will change the headline”). 3. Allocate 10% of your time or budget to a completely new content format to test the waters.
Frequently Asked Questions
How long should I wait before deciding a campaign has failed?
I recommend a minimum observation period of 14 to 30 days. Most social media algorithms require at least 7 days of data to properly categorize your content and find the right audience. If you pivot too early, you may be cutting off a campaign just as the “learning phase” is ending.
What is a “healthy” engagement rate for a growing account?
While it varies by industry, a healthy organic engagement rate typically falls between 1% and 3%. For accounts with very large followings (over 100k), this may dip below 1%, while smaller, niche accounts might see 5% or higher. Always compare your current rate against your own historical baseline rather than global averages.
How do I justify a strategic pivot to a client who wants to stay the course?
Use a Pivot Trigger Analysis. Show the client the data—such as a sustained 30% drop in reach or a rising cost per click—and explain that the “creative fatigue” threshold has been met. Presenting a data-backed reason for change makes the pivot look like a professional optimization rather than a guess.
Why does my organic reach drop when I start running paid ads?
There is a common myth that platforms “punish” organic reach to force you to pay. In reality, it is often a matter of focus. When marketers start running ads, they sometimes neglect the quality of their organic content. Additionally, if your ads are reaching the same people as your organic posts, the algorithm may prioritize the ad delivery.
What is the most important metric for LinkedIn growth?
On LinkedIn, “dwell time” is a primary factor. This is the amount of time users spend reading or looking at your post. This is why long-form text posts and PDF carousels often perform better than short updates or external links that take users away from the platform.
How often should I refresh my ad creatives?
For most small-to-medium budgets, refreshing creatives every 3 to 4 weeks is standard. If you are spending heavily, you may need to refresh them every 10 to 14 days. Monitor your “frequency” metric; if it goes above 3.0, it is usually time for a change.
Can I use the same content for TikTok and Instagram Reels?
Yes, but with minor adjustments. TikTok favors a more raw, “lo-fi” aesthetic and specific trending audio. Instagram Reels often perform better with slightly higher production value and a cleaner look. Always remove the watermark of one platform before posting to the other, as algorithms may de-prioritize watermarked content.
What should I do if my account growth completely stagnates?
First, audit your audience alignment. You may be reaching people who aren’t interested in your current offer. Second, look at your “shares” and “saves.” If people aren’t sharing your content, it isn’t providing enough value to trigger the discovery algorithm. Try a “Value-First” series where you give away your best advice for free for 14 days.
How do I set a realistic budget for a new social funnel?
Start with the 70/20/10 split. If you have $1,000, put $700 into your most successful post types, $200 into testing new variations, and $100 into a “wild card” idea. This protects your core results while allowing for the breakthroughs that drive long-term growth.
Why is my CTR high but my engagement low?
A high CTR means your “hook” is working—people are clicking. If engagement is low, it means the content they found after clicking didn’t meet their expectations. This is a “content mismatch.” Re-evaluate whether your headline or thumbnail accurately represents the actual content of the post.
(This article was written by one of our staff writers, Michael Reynolds. Visit our Meet the Team page to learn more about the author and their expertise.)