How to Fix Audience Drop After Changing Content Format (Case Study)
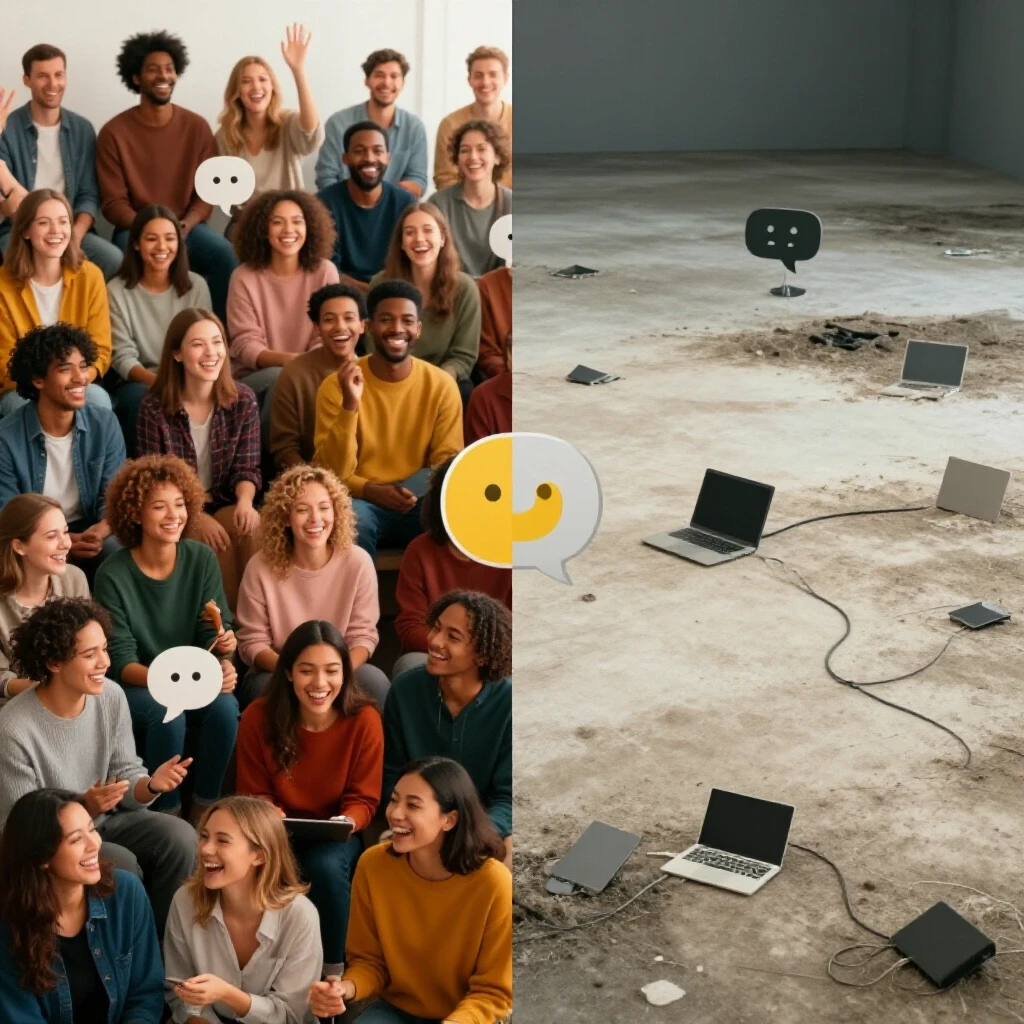
Imagine you just launched a high-budget transition in your content strategy. You followed every best practice, but instead of the expected growth, your reach plummeted and your core community stopped responding. This is the moment where most managers panic, but as someone who has spent 14 years in the trenches of social media operations, I know this is actually where the real work begins.
In my career, I have managed accounts for global brands where a single misaligned campaign led to a 60% drop in organic reach overnight. I remember sitting in a boardroom with a CMO who wanted to know why our “innovative” new video style was being met with silence and algorithmic suppression. The answer is rarely a simple “the algorithm changed.” It is usually a complex mix of operational errors, technical flags, and a fundamental disconnect in how the platform processes your new content signature.

Systematic Diagnosis of Content Delivery Shifts
This phase involves a deep dive into your account’s backend health to determine if a performance drop is due to technical penalties or a lack of resonance. By isolating variables like reach velocity and engagement variance, you can identify whether the platform is actively suppressing your content or if the delivery method itself is failing to trigger distribution.
Early in my career, I handled a recovery for a major retail brand that saw its impressions vanish after shifting to a high-frequency posting schedule. We initially thought it was a shadowban—a term for search suppression where your content doesn’t appear in hashtags or explore pages. However, our diagnostic workflow revealed that the rapid change in posting behavior triggered a “spam-like” threshold in the platform’s safety layers. We had to stop guessing and start looking at the raw data.
Root Cause Diagnostic Checklist
| Diagnostic Factor | Indicator of Technical Penalty | Indicator of Strategic Misalignment |
|---|---|---|
| Reach Velocity | Sudden, 80%+ drop in non-follower reach. | Gradual decline over 3-5 consecutive posts. |
| Search Visibility | Username does not appear in “Top” search results. | Search visibility remains high, but clicks are low. |
| Engagement Variance | High likes but near-zero comments or shares. | Low engagement across all interaction types. |
| Policy Status | “Account Status” shows specific violations. | Account status is green, but distribution is throttled. |
Algorithmic Penalty Diagnosis and Reach Velocity
An algorithmic penalty is a technical restriction placed on an account when its content patterns trigger safety or quality filters. Understanding reach velocity—the speed at which your content gains initial impressions—is critical here because it tells you if the platform is giving your new content a fair chance at the starting line.
When a brand changes its content signature, the platform’s “learning phase” resets. If your initial reach velocity is low, the system assumes the content is low quality. I once managed a brand that triggered a content moderation threshold simply because their new high-contrast editing style was flagged by an automated system as “distressing content.” We didn’t need a new creative team; we needed to understand the platform’s safety protocols.
Formulating Stakeholder Communications for Performance Stagnation
Effective stakeholder communication requires translating complex technical failures into actionable business insights. This process involves setting realistic recovery timelines, explaining the nuances of platform policy scoring, and managing expectations regarding the slow, methodical nature of rebuilding an account’s reputation after a significant engagement drop or public setback.
One of the hardest parts of my job is telling a stressed director that we cannot “fix” a reach drop in 24 hours. I have found that using a “Recovery Phase Timeline” helps calm the room. It shifts the conversation from “why is this happening?” to “how are we moving through the recovery stages?”
- Phase 1: Stabilization (Days 1-5): Stop the bleeding by pausing experimental formats and returning to baseline, safe content.
- Phase 2: Appeal and Audit (Days 5-15): Submit formal appeals for any flagged content and conduct a full audit of recent metadata and engagement patterns.
- Phase 3: Incremental Testing (Days 15-30): Slowly reintroduce elements of the new strategy while monitoring reach velocity thresholds.
- Phase 4: Full Restoration (Day 30+): Return to normal operations once engagement variance stabilizes within 10% of historical norms.
Navigating the Administrative Burden of Platform Appeals
When you are dealing with a potential social media shadowban, the appeal is your primary tool. But you cannot just click the “request review” button and hope for the best. I advise my teams to document everything. In one instance, we recovered a brand’s reach by proving that our new “edgy” format was actually within the “fair use” and “educational” guidelines of the platform, even though the AI had initially flagged it for removal.
- Identify the specific violation: Check your account health tab for any “not recommendable” flags.
- Gather evidence: Screenshot your historical reach metrics to show the exact moment the suppression began.
- Submit a concise appeal: Avoid emotional language. Use phrases like, “We believe this content was flagged in error as it meets all Community Guidelines regarding [specific policy].”
- Monitor the support interface: Check daily, as some platforms provide a 24-hour window for follow-up questions.
- Use a secondary channel: If the standard appeal fails, use your ad representative or a verified business support portal if available.
Executing a Community Recovery Sequence
A community recovery sequence is a strategic series of content pieces designed to rebuild trust and re-engage an audience that has become unresponsive. This involves moving away from the “new format” temporarily to focus on high-value, familiar content that encourages direct interaction and signals to the algorithm that your followers still value your presence.
I remember a project where a brand’s audience felt alienated by a sudden shift to overly polished, corporate-feeling videos. The reach was dying. We implemented a “back-to-basics” sequence. We stopped trying to be “innovative” and started being “useful.” We asked questions, responded to every single comment, and used the most basic image formats. Within two weeks, the algorithm saw the spike in “meaningful social interactions” and began opening the reach gates again.
- Acknowledge the shift: If the audience feedback is vocal, a simple “We hear you” post can do wonders.
- Prioritize “Save” and “Share” metrics: These are the strongest signals of content value.
- Reduce posting frequency: Focus on one high-quality, high-interaction post per day rather than three mediocre ones.
- Leverage direct engagement: Use polls and stickers to force the algorithm to see active participation.
Advanced Metrics for Long-Term Recovery Tracking
Long-term recovery tracking involves monitoring specific data points over several months to ensure the account has fully moved past an algorithmic penalty. Key metrics include the sentiment index rating, reach restoration percentage, and the report-to-view ratio, which measures how many users are flagging your content versus how many are consuming it.
To help my clients understand the recovery, I use a “Sentiment Tracking Index.” This isn’t just about “likes.” It’s a weighted score of how the audience is actually feeling. If your reach is coming back but your sentiment index is still negative, you haven’t recovered; you’ve just become more visible to people who don’t like your new direction.
Account Recovery Benchmarks
| Metric | Healthy Baseline | Warning Zone | Crisis Zone |
|---|---|---|---|
| Reach Restoration | 90% of 6-month avg | 50-70% of 6-month avg | <30% of 6-month avg |
| Sentiment Index | 80% Positive/Neutral | 40-60% Positive/Neutral | <30% Positive/Neutral |
| Report-to-View Ratio | <0.01% | 0.05% – 0.1% | >0.2% |
| Appeal Response Time | 3-5 Business Days | 10+ Business Days | No Response |
Implementing Ongoing Account Audits
Ongoing account audits are proactive reviews of your social media operations to prevent future reach drops. This includes checking for “ghost followers” that dilute your engagement rate, reviewing third-party app permissions that might trigger security flags, and ensuring all content creators are updated on the latest platform policy changes.
In my experience, many “sudden” drops aren’t sudden at all. They are the result of months of small policy “micro-violations” that eventually hit a tipping point. I now require my teams to do a “Brand Safety Audit” every 30 days. We look at our metadata, our hashtag sets, and even our automated moderation filters to make sure nothing is outdated.
- Audit Tool: Platform Health Dashboards. (e.g., Instagram Account Status, TikTok Safety Center).
- Audit Tool: Sentiment Analysis Software. (e.g., Brandwatch, Sprout Social).
- Audit Tool: Manual Reach Calculators. (Spreadsheets comparing non-follower reach vs. follower reach).
- Audit Tool: Policy Databases. (Regularly checking the official “Transparency Reports” from platforms).
- Audit Tool: Third-Party Permission Logs. (Removing any old apps that have access to your API).
Strategic Rebuilding of Audience Trust and Reach
Rebuilding trust requires a data-backed approach to content creation that prioritizes audience needs over internal creative desires. It is a slow process of proving to both the algorithm and the human audience that your account is a reliable source of high-quality, safe, and engaging content that deserves a spot in the primary feed.
When a new format fails, the natural instinct is to keep tweaking it. My advice? Stop. If the data shows a consistent decline, you need to pivot back to what worked while you analyze the failure in a “sandbox” environment. I once saw a brand lose 200,000 followers because they refused to admit their new aesthetic was making their content unreadable. Resilience in social media management isn’t about sticking to your guns; it’s about having the humility to follow the data back to success.
Key Takeaways for Recovery Specialists
- Don’t panic: A reach drop is a data point, not a death sentence.
- Diagnose before you act: Use the diagnostic table to see if your problem is technical or creative.
- Communicate clearly: Use timelines and metrics to manage your leadership’s expectations.
- Slow and steady: Recovery takes 15-30 days of consistent, safe behavior.
- Audit regularly: Prevention is much cheaper than recovery.
Frequently Asked Questions
How can I tell if my account has a shadowban or if the audience just dislikes the new content? Check your “Reach by Source” in your analytics. If your “Non-Follower” reach (from Explore or Search) has dropped to near zero while your “Follower” reach remains somewhat stable, you are likely facing a technical suppression or shadowban. If both have dropped equally, it is more likely that your new format is not resonating with your audience, causing the algorithm to stop recommending it.
How long does it take to recover from an algorithmic penalty? Most minor penalties or “cooldown periods” last between 7 and 14 days, provided you stop the behavior that triggered the flag. More severe violations can take 30 to 90 days of “clean” posting to fully restore your previous reach velocity.
Should I delete the posts that performed poorly? Generally, no. Deleting large amounts of content at once can actually trigger further spam filters. Instead, archive them one by one over a period of time, or simply leave them and focus on creating high-engagement “recovery” content to push the poor performers down the feed.
What is a “content moderation threshold”? This is a limit set by a platform’s AI. If a certain percentage of your posts are flagged for “borderline” content (content that doesn’t quite break rules but is close), the system may lower your overall account authority, leading to a general decrease in reach across all posts.
Can I appeal a reach drop if I don’t have a specific violation notice? Yes, though it is more difficult. You can use the “Report a Problem” feature to submit a technical ticket. Provide screenshots of your reach data and explain that you believe there is a technical error with your account’s distribution, as you have no active violations.
What is “reach velocity” and why does it matter? Reach velocity is the speed at which your post gains its first 100 or 1,000 impressions. If your velocity is high, the algorithm sees the content as “hot” and expands its reach. If your new format is slow to gain traction, the algorithm will kill its distribution early.
How do I explain a 50% reach drop to my boss without looking incompetent? Frame it as a “Technical Distribution Audit.” Explain that the new format triggered a learning phase reset in the algorithm and that you are currently in the “Stabilization Phase” of the recovery plan. Use data to show that you have identified the root cause and have a 30-day timeline for restoration.
Does changing my bio or account category affect my reach? Yes, significant changes to your account metadata can trigger a re-classification of your account. This often leads to a temporary dip in reach as the platform tries to figure out who your new “ideal audience” is.
What is a “sentiment index rating”? This is a metric used to quantify the “mood” of your comments and mentions. By categorizing comments as positive, neutral, or negative, you can see if your new format is causing a PR crisis even if the reach numbers look okay.
What are “meaningful social interactions” (MSI)? MSI refers to deep engagement like long comments, shares to stories, and direct messages. Platforms prioritize these over simple “likes.” If your new format only gets likes but no MSI, your reach will eventually stagnate.
(This article was written by one of our staff writers, Andrew Collins. Visit our Meet the Team page to learn more about the author and their expertise.)