First-Click vs Last-Click Attribution for Social Ads (Guide)
How to determine exactly where your social media budget is working requires more than just looking at a final dashboard. You must understand how to balance the value of the first time a user sees your brand against the moment they finally decide to buy. This guide shows you how to navigate these conflicting credit models to maximize your returns.
Navigating the Conflict Between Discovery and Final Action Credit
Assigning value to the start of a customer journey versus the very end is a constant struggle for marketing managers. This section defines how these two reporting methods function within social platforms and why choosing one over the other changes how you perceive your return on investment.
When I first started managing multi-million dollar budgets a decade ago, I noticed a recurring problem. My Facebook dashboard would claim 100 conversions, while my TikTok dashboard claimed 80 for the same period. Often, these were the same customers. This happens because of how platforms assign credit.
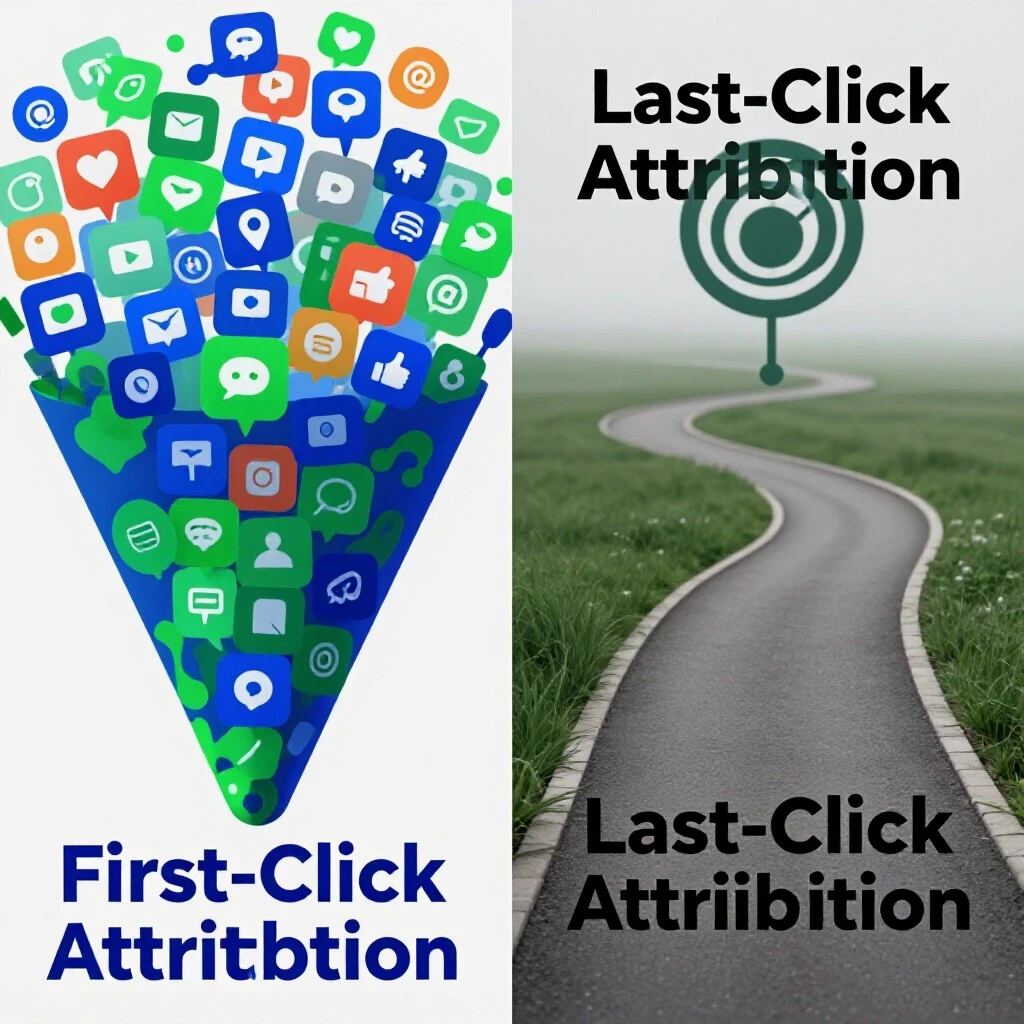
Initial discovery credit, often called the “first-click,” gives 100% of the conversion value to the very first ad a user interacted with. Think of this as the “Introduction.” It tells you which platform is best at finding new people who have never heard of you. In my experience, platforms with high discovery rates, like TikTok or Instagram Reels, often shine here.
Final action credit, or “last-click,” gives all the value to the last ad the user touched before buying. This is the “Closer.” It highlights which platforms are best at pushing someone over the finish line. Facebook Feed and LinkedIn sponsored content often dominate this area because they reach users when they are in a more transactional mindset.
Understanding this distinction is the first step in platform comparison analysis. If you only look at who closed the deal, you might accidentally cut the budget for the platform that introduced the customer to your brand in the first place.
Why Social Recommendation Engines Change Your Reporting Strategy
Platform algorithms dictate how content is seen, which directly impacts whether a channel acts as an “opener” or a “closer.” This section explores how different recommendation engines influence user behavior and, consequently, how you should assign value to those interactions.
Over the years, I have watched the “social graph” (who you follow) lose ground to the “interest graph” (what you like). This shift is critical for cross-platform marketing. On TikTok, the algorithm prioritizes discovery. It shows you content from people you don’t know. Naturally, this makes TikTok a powerhouse for initial discovery interactions.
In contrast, LinkedIn and Facebook still lean heavily on your professional and personal networks. Users on these platforms are often deeper in the “consideration” phase. When I ran a campaign for a B2B software client, LinkedIn provided very few “first touches,” but it was almost always the last place a user clicked before signing up for a demo.
| Platform | Primary Algorithm Driver | Typical Role in Journey | Organic Reach Comparison |
|---|---|---|---|
| TikTok | Interest-based discovery | Initial Discovery | High (Content-dependent) |
| Mixed (Followers + Interests) | Discovery & Consideration | Moderate | |
| Social Graph & Retargeting | Final Action / Conversion | Low (Ads-heavy) | |
| Professional Relevance | Final Action / Trust Building | Moderate | |
| X (Twitter) | Real-time Trending | Discovery / Engagement | High (Time-sensitive) |
Identifying Your Audience Through Demographic Mapping
Successful budget allocation depends on matching your target audience to the platform where they are most likely to take a specific action. This section breaks down current user trends and how they influence where you should look for discovery versus conversion.
According to data from the Reuters Institute, younger audiences are increasingly using social feeds as search engines. This changes the “first touch” dynamic. For a brand manager, this means your “introduction” credit might be moving toward video-first platforms.
- Ages 18–24: Heavily favor TikTok and Instagram for discovery. They rarely start a journey on Facebook.
- Ages 25–40: Split time between Instagram for discovery and LinkedIn for professional validation.
- Ages 40+: Remain highly active on Facebook, making it a primary spot for both discovery and final action.
In a recent project for a luxury travel brand, we found that users aged 35–45 discovered the villas on Instagram (First-Click). However, they didn’t book until they saw a detailed testimonial ad on Facebook two weeks later (Last-Click). If I had only looked at the final action, I would have moved the entire budget to Facebook. By keeping the budget split, we maintained a steady flow of new leads.
The 60/40 Rule for Social Channel Optimization
Balancing your budget between discovery-focused ads and conversion-focused ads is essential for long-term growth. This section outlines a practical framework for splitting your spend to ensure you are both filling the funnel and emptying it.
I often recommend a “60/40” budget split to the executive boards I advise. We allocate 60% of the budget to “Lead” channels—those that excel at initial discovery. The remaining 40% goes to “Support” channels—those that excel at the final action.
- Lead Channels (60%): Focus on broad reach and high engagement. Use video placements and “top-of-funnel” messaging. Measure success by cost-per-impression and initial click-through rates.
- Support Channels (40%): Focus on retargeting and direct-response. Use static images with clear calls to action. Measure success by cost-per-acquisition and final conversion rates.
This approach prevents the common mistake of over-funding the “closer” while starving the “opener.” It acknowledges that a user’s path is fragmented across multiple apps.
Troubleshooting Metric Discrepancies Across Platforms
When every platform claims credit for the same sale, marketing managers face a reporting nightmare. This section provides a checklist to help you interpret conflicting data and find the “ground truth” of your performance.
It is common to see a “conversion lift” in your platform dashboards that doesn’t match your actual bank account. This is because platforms use different “attribution windows”—the amount of time they track a user after a click.
- Check the Window: Ensure you are comparing a 7-day click window on Facebook with a 7-day click window on TikTok. If one is set to 30 days, it will naturally claim more credit.
- Identify Overlap: Use platform-native tools to see how many users saw ads on both platforms.
- Monitor Baseline Sales: Look at your total sales when all ads are off versus when they are on. This “incrementality” is the most honest metric you have.
I once worked with an agency founder who was frustrated because their LinkedIn ads showed a $500 cost-per-acquisition, while Facebook showed $50. After digging into the discovery data, we realized the LinkedIn ads were reaching CEOs who then told their managers to buy the product. The managers clicked the Facebook ad. LinkedIn was the “opener,” but Facebook got the “last-click” credit.
Asset Customization for Different Stages of the Journey
An ad designed for discovery should look and feel different from an ad designed to close a sale. This section details how to tailor your creative assets to match the credit model you are prioritizing for each platform.
For initial discovery interactions, your creative must be “thumb-stopping.” On TikTok and Instagram Reels, this means using high-energy, native-looking video. You aren’t asking for a sale yet; you are asking for attention.
For the final action, your creative should be “frictionless.” On Facebook or LinkedIn, this means clear value propositions, professional imagery, and a very obvious “Shop Now” or “Sign Up” button.
Placement-Level CTR Benchmarks: * Discovery Placements (Reels/TikTok): 0.8% to 1.5% is healthy. You want high engagement and watch time. * Conversion Placements (Feed): 1.5% to 3.0% is the goal. You want people to leave the app and visit your site.
A Unified Reporting Template for Executive Boards
Justifying your budget to a board requires a clear way to show how discovery spend leads to final sales. This section provides a structure for a unified report that balances both ends of the customer journey.
When I present to boards, I avoid getting bogged down in platform-specific jargon. Instead, I use a “Unified Performance Card.” This helps them see the social channel optimization as a single engine with different parts.
- The Awareness Engine (Discovery): Total reach, new visitors, and cost-per-first-touch across TikTok and Instagram.
- The Conversion Engine (Final Action): Total sales, return on ad spend (ROAS), and cost-per-acquisition across Facebook and LinkedIn.
- The Holistic ROI: The total spend divided by total revenue, regardless of which platform claimed the “last click.”
This high-level view proves that you aren’t just “spending money on TikTok because it’s trendy.” You are using it as a strategic “opener” to feed your “closers.”
Common Pitfalls in Cross-Platform Performance Metrics
Even seasoned managers make mistakes when comparing platform performance. This section highlights the most frequent errors and how to avoid them to ensure your budget is actually delivering a return.
One of the biggest mistakes is the “Last-Click Trap.” This happens when a manager sees a low ROAS on a discovery platform and moves all the money to the platform with the highest ROAS. Within three months, the “high-performing” platform’s ROI usually collapses because the top of the funnel has dried up.
Another mistake is ignoring “platform-native retention signals.” For example, if people are watching 100% of your video on TikTok but not clicking, that platform is still doing a massive amount of “heavy lifting” for your brand awareness. That value won’t show up in a final action report, but it will show up in your overall brand search volume.
Practical Steps for Reallocating Your Budget
If you find that your current strategy is too heavily weighted toward one end of the journey, you need a plan to rebalance. This section provides a step-by-step guide for moving budget safely without crashing your performance.
- Audit Your Current Split: Determine what percentage of your budget is going to “discovery” vs. “conversion” placements.
- Test Incrementally: If you want to increase discovery spend, move 5-10% of your budget at a time. Watch your total sales, not just the platform’s reported sales.
- Verify Setup: Ensure your tracking pixels are firing correctly on all platforms. Discrepancies often stem from technical errors rather than audience behavior.
- Review Weekly: Social algorithms change. A placement that worked as a “closer” last month might become an “opener” this month due to a feed update.
Conclusion: Building a Balanced Social Strategy
Start by identifying which of your current channels are your “openers” and which are your “closers.” Stop looking for a single platform to do everything. By respecting the unique roles of TikTok, Instagram, LinkedIn, and Facebook, you can build a diversified portfolio that stands up to executive scrutiny and delivers consistent, long-term ROI.
Frequently Asked Questions
Which credit model is better for a limited marketing budget?
Neither model is inherently better, but for a limited budget, focusing on final action reporting (last-click) is often safer for immediate cash flow. It ensures you are spending money where the sale actually happens. However, as soon as your sales plateau, you must shift some budget to discovery-based reporting (first-click) to find new customers, or your growth will stall.
Why does Facebook show more conversions than my internal sales database?
This usually happens because Facebook uses a “view-through” window. If a user sees your ad, doesn’t click, but buys your product three days later, Facebook will claim credit. Most internal databases only count “click-through” sales. To get a more accurate comparison, adjust your platform settings to only show “7-day click” conversions.
How do I explain the value of “discovery” ads to a CFO who only cares about ROAS?
Explain it using a “sports analogy.” The CFO’s favorite platform (the closer) is the person who scores the goal. But the discovery platform is the person who passed them the ball. If you fire the person who passes the ball, the star player will never score again. Show the correlation between discovery spend and the volume of “last-click” conversions.
Can a single platform like Instagram act as both an opener and a closer?
Yes, but usually through different placements. Instagram Reels is a powerful discovery tool (opener), while Instagram Stories or Feed ads are often better at driving final actions (closers). You should treat these placements as separate line items in your budget to see how each contributes to the journey.
What is the biggest sign that I am over-valuing the final action?
The biggest sign is “Frequency Fatigue.” If your “closing” ads have a very high frequency (the same people seeing the ad 5+ times) but your sales are flat, you are likely over-targeting the same small pool of people. You need to move budget back to discovery platforms to find “fresh” audiences who haven’t seen your brand yet.
How often should I change my budget split between platforms?
I recommend a formal review every quarter. However, you should monitor “platform-native” trends weekly. If a platform like TikTok updates its algorithm and your organic reach drops, you may need to increase your paid discovery spend to maintain the same level of “first-touch” interactions.
Why is my LinkedIn cost-per-click so much higher than Facebook’s?
LinkedIn is a “high-intent” professional environment. While the click is more expensive, the “quality” of that click for a B2B business is often much higher. In a final action model, LinkedIn might look expensive, but if those clicks turn into larger contracts, the ROI is actually superior. Always look at the “Lead-to-Deal” ratio, not just the cost-per-click.
Does “organic reach” still matter for discovery credit?
Yes, but it is increasingly rare. Platforms like TikTok and X still offer some organic discovery potential. If a post goes viral organically, it acts as a “free” first-click. You should track these organic spikes and see if they lead to an increase in your paid “last-click” conversions on other platforms a few days later.
Should I use the same creative for both first-click and last-click objectives?
No. Using discovery-style creative (like a trend-based video) for a conversion objective usually results in a high bounce rate. Conversely, using a “Buy Now” static ad for discovery usually results in very low engagement. Tailor your creative to the specific role that platform plays in your customer’s journey.
What is “incrementality” and why is it important for this debate?
Incrementality is a test where you turn off ads in a specific region or for a specific time to see what happens to your “baseline” sales. It is the only way to truly know if a platform is actually driving new business or just claiming credit for a sale that would have happened anyway. It is the “gold standard” for resolving reporting discrepancies.
(This article was written by one of our staff writers, Jonathan Mercer. Visit our Meet the Team page to learn more about the author and their expertise.)