Meta Ads vs Google Ads Attribution: Which Drives Better ROI? (Guide)
Explaining digital credit assignment to a board of directors is often like trying to explain why both parents want 100% of the credit for their child’s straight-A report card. In the world of digital spending, both the search giant and the social kingpin will happily claim the same sale as their own. If you add up the revenue reported in your individual dashboards, you might find you are “earning” twice as much as what is actually landing in your bank account.
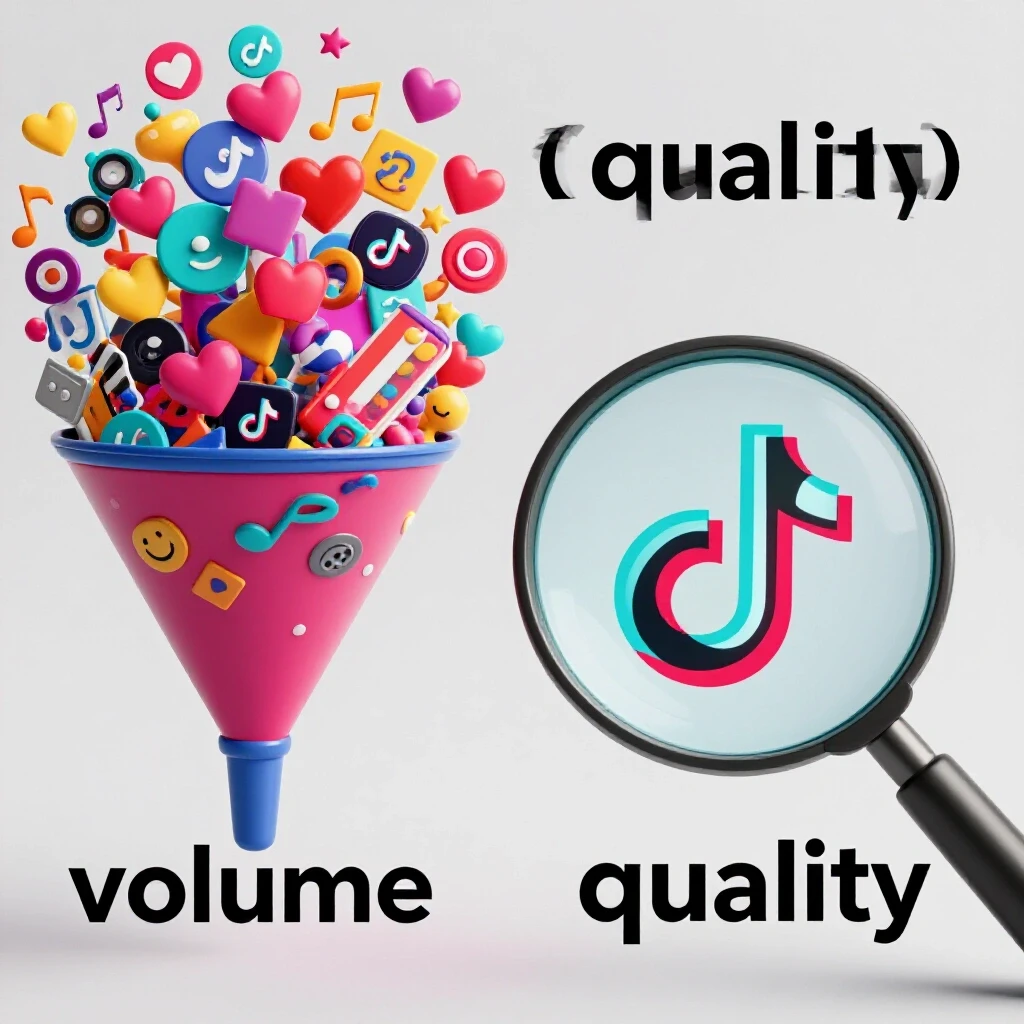
Why Conflicting Performance Data Complicates Your Budget Decisions
This section explores how different advertising ecosystems record and report user actions. Understanding these fundamental differences is vital for any manager who needs to reconcile why one platform claims a sale that another also takes credit for in a multi-channel environment.

Early in my career, I managed a high-growth e-commerce brand where the CEO was obsessed with “last-click” metrics. We were spending heavily on search and social simultaneously. One Monday morning, the social dashboard reported $20,000 in sales, while the search dashboard reported $15,000. The actual store revenue was only $22,000. I had to explain that a customer saw a video on their feed, didn’t click, but later searched for the brand and bought. Both platforms were technically right, but our budget was being guided by a lie.
This “double-counting” happens because of how tracking pixels and cookies work. A platform-native ad placement on a social feed might influence a user on Monday, but they might not buy until Wednesday after clicking a search ad. To solve this, we must look at a platform comparison analysis that accounts for the path a user takes, rather than just the final click.
Navigating the Shift from Last-Click to Data-Driven Credit
This subtopic defines the move away from giving all credit to the final touchpoint a user interacts with before buying. It explains why modern marketing requires a more nuanced view that looks at every interaction a customer has with your brand across different touchpoints.
Last-click was the gold standard for years because it was easy to measure. However, it ignores the “top of the funnel” where people first discover your product. If you only fund the last click, you are essentially firing your sales team and only paying the cashier. Data-driven models use machine learning to look at all your data to figure out which ads actually moved the needle.
In my experience, moving a client from last-click to a data-driven model usually reveals that social ads are doing much more work than they get credit for. For example, a 2023 Reuters Institute report noted that younger audiences are increasingly using social discovery over traditional search. If your measurement doesn’t reflect this, you might accidentally cut the very ads that are filling your pipeline.
- Last-click: Only the final ad gets the credit.
- First-click: Only the first ad the user saw gets the credit.
- Linear: Every ad in the journey gets equal credit.
- Time-decay: Ads closer to the sale get more credit than older ones.
Decoding the Tracking Methods of Search and Social Giants
We define the technical ways these platforms “see” a conversion, including the difference between clicking an ad and simply seeing one. This foundational knowledge helps managers understand why their reporting tools rarely agree and how to spot the “true” performance of a campaign.
The way we track people has changed drastically since 2021. With the decline of third-party cookies and the rise of privacy features like Apple’s App Tracking Transparency (ATT), we can no longer follow a user perfectly from a scroll to a sale. This has led to “modeled conversions,” where platforms use math to guess how many people bought something based on the data they can still see.
I recently worked with a client who saw their social “Return on Ad Spend” (ROAS) drop by 40% overnight after a major privacy update. The sales hadn’t actually dropped; the platform just couldn’t “see” them anymore. We had to implement server-to-server tracking to bridge the gap. This is why cross-platform marketing requires a look at “blended” metrics—total spend divided by total revenue—rather than relying on a single dashboard.
Understanding View-Through vs. Click-Through Metrics
This section explains the difference between a user clicking an ad (click-through) and a user seeing an ad but buying later without clicking (view-through). Understanding these two signals is essential for evaluating the real impact of visual media versus text-based search results.
A “click-through” is a clear signal of intent. The user saw something, liked it, and took action. A “view-through” is more subtle. Imagine you see a billboard for a burger. You don’t stop your car and call the number on the billboard. But two hours later, you’re hungry and you pull into that specific burger chain. The billboard worked, even though you didn’t “click” it.
Social platforms rely heavily on view-through data because people rarely leave their feed to buy something immediately. Search platforms, on the other hand, are almost entirely click-based because the user is actively looking for a solution. If you ignore view-through data, your social channel optimization will look like a failure, even if it is driving all your search traffic.
| Metric Type | Definition | Best Use Case |
|---|---|---|
| Click-Through (CTR) | Percentage of people who clicked after seeing the ad. | Measuring direct response and offer clarity. |
| View-Through (VTC) | People who saw the ad and bought later without clicking. | Measuring brand awareness and “billboard” effect. |
| Conversion Rate (CVR) | Percentage of clicks that resulted in a sale. | Measuring website performance and lead quality. |
Aligning Your Budget with Audience Demographic Trends
This section looks at where different age groups spend their time and how their behavior on those platforms dictates the type of ads you should run. We analyze how demographic shifts impact the cost and effectiveness of your digital placements.
You cannot treat every platform the same because the people on them are looking for different things. A 45-year-old on a search engine is usually trying to solve a specific problem, like finding a plumber. A 25-year-old on a social feed is looking for entertainment or inspiration. I’ve seen many brands fail because they tried to run “search-style” ads—boring, text-heavy, and direct—on a social platform where users want high-energy video.
According to eMarketer data, the “silver surfer” demographic (ages 55+) is the fastest-growing group on Facebook, while Gen Z has largely migrated to short-form video platforms. As a manager, you must shift your budget to follow these audience demographic trends. I once had to convince a client to retire their underperforming X (formerly Twitter) account because their target audience of “busy moms” had completely moved to Instagram Reels. It wasn’t about the platform being “bad”; it was about the audience no longer being there.
Placement-Level Performance and User Behavior
This subtopic breaks down how different spots within a platform, such as a “Story” versus a “Feed” or a “Search Result” versus a “Display Banner,” perform differently. We examine why matching the creative to the specific placement is the key to maintaining a healthy return on investment.
Not all ad spots are created equal. A “Feed” ad is like a magazine entry; it needs to be polished. A “Story” or “Reel” ad is like a FaceTime call; it should feel raw and personal. When we look at placement-level CTR trends, we often see that “native-looking” content outperforms high-production commercials by 2x or 3x.
In a recent cross-channel test, we found that search ads had a much higher cost-per-click (CPC) but a much higher conversion rate. Meanwhile, social ads had a very low CPC but required more “touches” to get a sale. By balancing the two, we kept the overall cost per acquisition (CPA) within the client’s target.
- Search Results: High intent, high cost, high conversion.
- Social Feed: Medium intent, medium cost, visual-heavy.
- Social Stories: Low intent, low cost, high engagement.
- Display Banners: Very low intent, very low cost, brand reminders.
Formulating a Real Placement Blueprint
We provide a step-by-step guide on how to split your marketing dollars between different platforms based on your specific business goals. This section moves from theory to execution, offering a framework for testing and scaling your ad spend.
When I build a budget for a client, I don’t guess. I start with a 60/40 split. 60% of the budget goes to the “lead” channel—the one we know works—and 40% goes to the “support” channel. If search is our lead channel for a B2B client, we use social to “warm up” the audience so that when they finally see us on a search page, they already trust us.
I remember a project for a luxury watch brand where we tried to spend 100% on search. The problem? No one was searching for the brand because they didn’t know it existed. We had to flip the script. We spent 70% on social to create the “want” and 30% on search to capture the “intent.” This platform-native ad placements strategy saved the campaign from being a total loss.
Troubleshooting Metric Discrepancies Across Networks
This section addresses the common “he-said, she-said” problem between different reporting tools. We offer practical ways to find the truth when your dashboards provide conflicting numbers.
The first thing to do when metrics don’t match is to check your “Attribution Window.” One platform might be counting a sale if someone saw an ad 28 days ago. Another might only count it if they clicked in the last 24 hours. To compare them fairly, you must set them to the same window.
I use a “Unified Report Card” system. Instead of looking at each platform’s individual ROAS, I look at the “Marketing Efficiency Ratio” (MER). This is simply: Total Revenue / Total Ad Spend. It is the only number that cannot be faked or double-counted. If your MER is going up, your strategy is working, even if one platform claims it’s doing all the work.
- Standardize your attribution windows (e.g., 7-day click, 1-day view).
- Use UTM parameters on every link to track clicks in a third-party tool like Google Analytics.
- Check for “overlap” by running a “lift study” where you turn off ads in one region to see if total sales actually drop.
- Focus on “Incremental Revenue”—the sales you wouldn’t have had if the ads weren’t running.
Unified Reporting and The Path to Holistic ROI
This final section explains how to bring all your data together into a single view that makes sense to an executive board. We focus on the “big picture” metrics that prove the value of your multi-channel strategy.
At the end of the day, your board doesn’t care about “likes” or “impressions.” They care about profit. To justify your budget, you need to show how search and social work together. I often use an analogy of a basketball team: Social is the player who makes the amazing pass (the assist), and Search is the player who dunks the ball (the score). You can’t win the game with only one player.
By using cookie-less tracking strategies and looking at longitudinal data (data over a long period), you can show that as you increased social spend, your “branded search” volume also went up. This proves that your social channel optimization is actually making your search ads cheaper and more effective.
Practical Checklist for Multi-Channel Managers
Use this checklist to ensure your reporting is accurate and your budget is being spent in the right places.
- Verify that your tracking pixels are firing correctly on all “Thank You” pages.
- Ensure UTM parameters are used on 100% of your ad links.
- Set a “Maximum Acceptable CPA” for each channel based on its role (e.g., higher for search, lower for social).
- Conduct a monthly “Blended ROAS” check to ensure total profitability.
- Review “Assisted Conversions” in your analytics tool to see which channels are helping others.
- Update your creative assets every 2-4 weeks to avoid “ad fatigue” on social platforms.
Frequently Asked Questions
Why does Facebook show more sales than my Google Analytics?
Facebook uses a “People-Based” tracking system, while Google Analytics (by default) uses “Cookie-Based” tracking. If a user sees an ad on their phone but later buys on their laptop, Facebook can often link those two events because the user was logged in on both devices. Google Analytics may see these as two different people, often giving credit to the “Direct” or “Search” visit on the laptop instead of the original social ad.
What is a “good” attribution window for a small business?
For most businesses, a “7-day click and 1-day view” window is the most realistic. This means the platform takes credit if someone clicks and buys within a week, or sees the ad and buys within 24 hours. Longer windows (like 28 days) often lead to over-reporting, while shorter windows might hide the true value of your brand-building efforts.
How do I know if my social ads are actually driving search traffic?
Look at your “Branded Search” volume in your search dashboard. If you see a spike in people searching for your specific company name during the weeks your social ads are running, that is a clear sign of “spillover.” This is one of the strongest indicators that your social channel optimization is working.
Should I trust “Modeled Conversions” in my ad dashboard?
Trust them, but verify them. Modeled conversions are the platform’s “best guess” using machine learning. They are usually directionally correct (meaning if the number goes up, your sales are likely going up), but they should never be your only source of truth. Always compare them against your actual bank deposits and “Blended ROAS.”
Why is my search CPC so much higher than my social CPC?
Search ads are “pull” marketing; you are paying to appear in front of someone who is actively looking to buy. This intent is expensive. Social ads are “push” marketing; you are interrupting someone’s scroll. Because the intent is lower, the cost to get a click is generally lower. You are paying for the “convenience” of the searcher’s ready-to-buy mindset.
What is the Marketing Efficiency Ratio (MER) and why is it important?
MER is calculated by taking your total revenue and dividing it by your total ad spend across all platforms. It is the “North Star” metric for managers because it doesn’t care about attribution arguments. It simply tells you if your total marketing machine is profitable. If your MER is 4.0, you are making $4 for every $1 spent, regardless of which platform claims the win.
How often should I reallocate budget between platforms?
Avoid making big changes more than once every two weeks. Algorithms need time to “learn” and stabilize after a budget shift. I recommend a monthly deep-dive where you look at the last 30 days of data and move 10-15% of the budget from the worst-performing channel to the best-performing one.
Does organic reach affect my paid ad performance?
While organic reach has declined significantly (often below 2% for many brands), a healthy organic presence provides “social proof.” When someone clicks your paid ad and visits your profile, seeing recent, high-quality organic posts makes them more likely to trust you and convert. Think of organic as the “storefront” and paid as the “sign on the highway.”
(This article was written by one of our staff writers, Jonathan Mercer. Visit our Meet the Team page to learn more about the author and their expertise.)