How to Avoid Scaling Social Media Ads Too Soon (Expert Guide)
Managing a multi-channel marketing portfolio is a balancing act that extends far beyond the digital dashboard. You are likely juggling the demands of a high-growth business with the basic human need for stability and a life outside of office hours. When you spend your day analyzing cross-platform performance across Instagram, TikTok, LinkedIn, and Facebook, the pressure to deliver immediate results can be overwhelming. This pressure often leads to a common mistake: moving too quickly when a campaign shows a glimmer of success.
I have spent over a decade navigating these waters. I have seen the stress that comes when a client demands to know why the LinkedIn numbers do not match the internal sales data. I have felt the pit in my stomach when a sudden privacy update breaks a once-reliable tracking setup. Through these experiences, I learned that the most dangerous moment for a campaign is not when it is failing, but when it first starts to succeed.

Establishing a Resilient ROI Tracking Framework
An ROI tracking framework is a structured method for measuring the financial return of advertising spend. It combines platform-reported data with internal sales figures to provide a clear picture of overall profitability. This system helps managers identify which channels are actually driving revenue versus those simply showing high engagement numbers.
To build a framework that survives the reality of modern advertising, you must look past the surface-level metrics. In my early years, I relied heavily on what the platforms told me. If a dashboard showed a 4x return, I believed it. Today, I know that cross-platform performance is often a game of shadows. One platform might claim credit for a sale that another platform actually initiated.
I now focus on a “blended” approach. This means looking at your total marketing spend divided by your total revenue, often called the Marketing Efficiency Ratio (MER). This metric acts as a North Star. It keeps you grounded when individual platforms report conflicting data. By tracking MER alongside your customer acquisition cost (CAC), you can see if your scaling efforts are actually growing the business or just increasing your overhead.
- Total Ad Spend / Total Revenue = Blended ROAS (MER)
- Total Ad Spend / New Customers = Blended CAC
- Platform Revenue / Platform Spend = Platform ROAS (Use as a relative guide, not absolute truth)
Defining Your Attribution Windows
An attribution window is the period of time after a user interacts with an ad during which a conversion is credited to that ad. Different platforms use different defaults, such as a 7-day click or a 1-day view. Understanding these windows is vital for comparing performance across diverse channels like TikTok and LinkedIn.
When I managed a large e-commerce account during a major privacy rollout, our tracking became fragmented overnight. We had to move from a 28-day window to a 7-day window. This change made our campaigns look like they were failing, even though sales remained steady. It taught me that consistency is more important than perfection. Pick a window that reflects your customer’s typical buying journey and stick to it across all channels to maintain an objective view.
Validating First-Party Data Loops
First-party data loops involve using your own customer information, such as email lists or purchase history, to improve ad targeting and measurement. By feeding this data back into your advertising systems, you create a more accurate picture of who is buying. This reduces reliance on third-party tracking that is often blocked by privacy settings.
I found that campaigns using first-party data are much more resilient to platform shifts. When you upload a list of existing customers to create “lookalike” audiences, you are giving the platform a clear map of success. This is far more effective than relying on broad interest targeting, which has become less reliable in recent years. This data loop ensures that your multi-channel advertising budget is being spent on the people most likely to convert.
Why Accelerating Budget Before Metric Stabilization Fails
Accelerating a budget prematurely occurs when a manager increases spend based on short-term data before the campaign metrics have reached a stable state. This often leads to a sharp increase in customer acquisition costs and a drop in overall profitability. True stabilization requires consistent performance over at least two full sales cycles.
I once managed a campaign on X (formerly Twitter) that looked like a breakout success within the first 48 hours. The cost-per-click was incredibly low, and the initial conversion rate was high. My instinct, and the pressure from the board, was to triple the daily spend immediately. I ignored my own rules and hit the “scale” button. Within three days, the CPA quadrupled. The early success was a statistical fluke, a small pocket of high-intent users that the algorithm found quickly but could not replicate at scale.
Identifying the False Positive Trap
A false positive in advertising is a short-term spike in performance that does not represent the long-term potential of a campaign. These spikes can be caused by a small, highly active audience or a temporary lack of competition in the ad auction. Scaling during a false positive leads to wasted spend and skewed data.
To avoid this, I now implement a “wait-and-see” period. Even if a campaign looks perfect, I do not touch the budget for at least seven days. This allows the platform’s algorithm to move past the initial “learning phase.” During this time, you are looking for a steady trend line rather than a series of erratic peaks and valleys. If the metrics hold steady for a week, you have a much stronger foundation for growth.
The Impact of Audience Saturation
Audience saturation happens when your ads have been shown to your target market so many times that they stop responding. This leads to higher costs and lower engagement. When you scale too fast, you exhaust your best audience segments quickly, leaving you with a high bill and no new customers.
I have seen this happen frequently on LinkedIn, where audiences are often smaller and more specialized. If you increase your budget too aggressively, you end up showing the same ad to the same group of professionals five times a day. They don’t just stop clicking; they start to view your brand negatively. Monitoring your “frequency” metric is essential. If your frequency climbs while your ROAS drops, you are hitting a wall.
| Metric | Stability Indicator | Scaling Signal |
|---|---|---|
| CTR (Click-Through Rate) | Fluctuates by >20% daily | Remains within 5% over 7 days |
| CPA (Cost Per Acquisition) | Trending upward with spend | Stable or decreasing as spend rises |
| Frequency | Under 2.0 per week | Remains low even with budget increases |
| Blended ROAS | Below break-even point | Consistently 20% above break-even |
Balancing Multi-Channel Advertising Budget Allocations
Budget allocation is the process of distributing your total marketing spend across different platforms and campaign types. A balanced allocation protects your business from the volatility of a single platform while allowing for experimentation in new areas. This strategy ensures long-term stability and sustainable growth.
Managing a diversified portfolio requires a disciplined approach to where every dollar goes. I typically follow a 50/30/20 rule. I put 50% of the budget into the “core” platform that has proven, long-term returns. 30% goes into a secondary platform that shows strong potential. The final 20% is reserved for “emerging” channels or experimental creative. This structure prevents a single platform’s algorithm update from sinking your entire marketing department.
- Core Platform (50%): Your most stable source of revenue.
- Secondary Platform (30%): Proven but perhaps more expensive or volatile.
- Experimental (20%): New platforms or radical creative tests.
Setting Target CPA Limits
A target CPA limit is the maximum amount you are willing to pay to acquire a single customer while remaining profitable. This figure is derived from your product’s margin and the lifetime value of your customers. Setting a firm limit prevents emotional decision-making during periods of high competition.
I always calculate two CPA numbers: the “Break-Even CPA” and the “Target CPA.” The Break-Even CPA is the absolute maximum we can spend without losing money on the first transaction. The Target CPA includes the profit margin required to keep the business healthy. When a campaign’s cost exceeds the Target CPA for more than three days, I treat it as a warning sign to investigate rather than a reason to spend more.
Mapping Customer Lifetime Value (LTV)
Customer Lifetime Value is the total amount of money a customer is expected to spend with your business over the duration of your relationship. Understanding LTV allows you to justify a higher initial acquisition cost if you know the customer will return. This is a critical metric for long-term ad spend justification.
In one case study involving a subscription-based service, our initial social media ad ROI looked poor on day one. However, when we analyzed the data over six months, we found that customers acquired through LinkedIn stayed 40% longer than those from other platforms. By mapping this LTV, we were able to justify a higher CPA on LinkedIn. This shifted the conversation with the executive board from “why is this expensive?” to “how can we get more of these high-value customers?”
Creative Variation by Platform and Funnel Stage
Creative variation involves tailoring your ad content—images, videos, and copy—to fit the specific audience and format of each social media platform. It also requires matching the message to the user’s current stage in the buying journey. This ensures your ads are relevant and engaging, which keeps costs down.
You cannot simply take a high-production TV commercial and crop it for a TikTok ad. I have learned that the hard way. Each platform has its own “language.” On Instagram, aesthetics often drive performance. On TikTok, authenticity and “lo-fi” content usually win. When you scale a campaign, you need a library of creative assets ready to go. If you use the same single image for a massive budget increase, you will see your performance crater as creative fatigue sets in.
- Top of Funnel (Awareness): Educational videos, brand stories, and problem-solving content.
- Middle of Funnel (Consideration): Case studies, testimonials, and product demonstrations.
- Bottom of Funnel (Conversion): Limited-time offers, free trials, and direct calls to action.
Resolving Platform Attribution Gaps
Attribution gaps occur when different platforms provide conflicting data about which ad caused a sale. This is a common issue in multi-channel marketing, where a user might see an ad on Facebook but eventually buy after a search on Google. Resolving these gaps requires a holistic view of the customer journey.
I often use “post-purchase surveys” to bridge these gaps. Simply asking a customer “How did you hear about us?” provides a layer of truth that no pixel can match. Interestingly, I have found that customers often mention platforms that the digital tracking missed entirely. This qualitative data is a powerful tool for justifying budget to stakeholders who want to see exact attribution matches.
Preparing Executive Dashboards for Justification
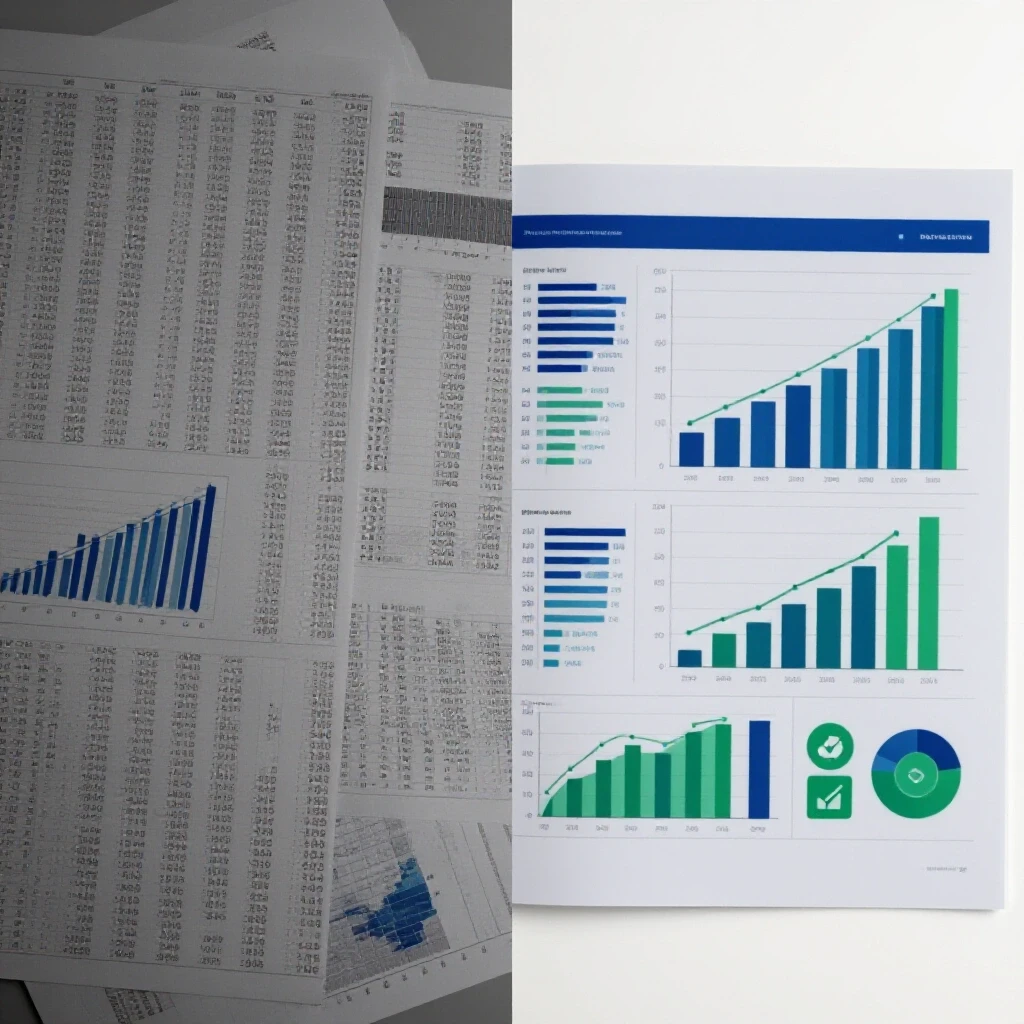
An executive dashboard is a high-level report that summarizes key performance indicators (KPIs) for decision-makers. It focuses on business outcomes like revenue and profit rather than technical metrics like click-through rates. A good dashboard tells a clear story about how marketing spend is driving business growth.
When I present to a board, I move the technical jargon to the appendix. They don’t need to hear about “Conversion APIs” or “standard events.” They want to see the relationship between the multi-channel advertising budget and the bottom line. I use simple visualizations that show the trend of our blended ROAS over time. This builds trust and gives me the freedom to manage the day-to-day optimizations without constant interference.
- Blended ROAS Trend: A line chart showing overall efficiency.
- New Customer Growth: A bar chart showing volume over time.
- Channel Contribution: A pie chart showing spend vs. revenue by platform.
- CPA vs. Target: A simple gauge showing if we are within our profitable limits.
Practical Steps for Sustainable Scaling
Scaling a campaign should be a gradual, data-driven process rather than a sudden leap. By following a structured approach, you can increase your reach while maintaining your profit margins. This requires patience and a willingness to dial back spend if the data takes a turn for the worse.
My rule of thumb is the “20% every 48 hours” rule. If a campaign is performing well, I increase the budget by no more than 20%. Then, I wait at least two days to see how the auction reacts. This slow approach allows the algorithm to adjust without sending the costs into a tailspin. It is much easier to correct a small mistake than a massive one.
- Step 1: Verify the data. Ensure your platform numbers align with your internal sales.
- Step 2: Check the frequency. Ensure you aren’t over-saturating your audience.
- Step 3: Incrementally increase spend. Use the 20% rule to maintain stability.
- Step 4: Monitor for 48-72 hours. Look for a stable CPA before moving again.
- Step 5: Refresh creative. Have new assets ready before the old ones fatigue.
Common Rookie Mistakes to Avoid
One of the biggest mistakes is “tinkering” too much. Every time you make a change to a campaign, you risk sending it back into the learning phase. I have seen managers change the headline, the image, and the budget all in one day. When performance drops, they have no idea which change caused it. Change one variable at a time so you can track the impact objectively.
Another mistake is ignoring the “delayed attribution” effect. On platforms like LinkedIn or Meta, a user might see an ad today but not buy until next Tuesday. If you cut the budget on Sunday because the Saturday numbers looked low, you are making decisions based on incomplete data. Always look at a 7-day or 14-day window before making major strategic shifts.
FAQ: Navigating the Economics of Social Advertising
How do I know if a campaign is truly ready to scale? A campaign is ready when it has maintained a stable CPA and a ROAS above your target for at least seven consecutive days. You should also check that your audience size is large enough to handle increased spend and that your creative frequency is low (typically under 2.0-3.0).
What is a healthy blended ROAS for a multi-channel brand? This varies by industry, but a common benchmark for healthy growth is a 3.0x to 4.0x blended ROAS (MER). This usually leaves enough margin for COGS, shipping, and operational overhead while still allowing for a net profit.
How often should I check my ad accounts? While it is tempting to check every hour, this often leads to reactive decision-making. I recommend a deep dive once a day to check for major anomalies and a strategic review once a week to make budget and creative adjustments.
Why does my platform ROAS always look better than my actual bank account? Platforms often use “view-through” attribution, meaning they take credit if someone saw an ad but didn’t click. Additionally, multiple platforms may claim credit for the same sale. This is why tracking your blended MER is the only way to see the true economic impact.
What should I do if my CPA spikes after a budget increase? Immediately stop further increases. If the CPA remains high for more than 48 hours, consider reverting to the previous budget level. A spike often indicates that you have moved into a more expensive or less relevant pocket of the ad auction.
How do I justify a “failing” platform to my boss? Focus on the “assisted conversion” value. Use your tracking tools to show that while Platform B might not be closing sales, it is often the first touchpoint for customers who eventually buy through Platform A.
Is first-party data really that important for scaling? Yes. As third-party cookies disappear, your own data becomes your greatest competitive advantage. It allows for more accurate targeting and better optimization, which directly lowers your long-term customer acquisition costs.
When should I give up on a new platform? I typically give a new platform at least 30 to 60 days of consistent testing with a dedicated “experimental” budget. If you cannot reach a stable, near-profitable CPA within that window after trying multiple creative styles, it may not be the right fit for your current product.
What is the “learning phase,” and why does it matter? The learning phase is the period when an algorithm is gathering data to figure out who is most likely to convert. During this time, performance is volatile. Making changes during this phase resets the clock, which wastes money and delays results.
How do I handle creative fatigue in a scaled campaign? The best way is to have a “testing” campaign running alongside your “scaling” campaign. Use the testing campaign to find new winning images or videos with a small budget, then move the winners into the scaled campaign as the old ones start to fade.
What is the best way to compare LinkedIn and TikTok performance? Compare them based on their role in the funnel. TikTok is often a high-volume, low-cost awareness play, while LinkedIn is a high-cost, high-intent lead generator. Use a blended ROAS to see how they work together to drive the final business outcome.
How do I explain tracking discrepancies to a client? Be honest about the limitations of digital tracking. Explain that pixels are not 100% accurate due to privacy settings and cross-device behavior. Shift the focus to “Total Revenue” and “Total Spend,” which are the only numbers that truly matter to the business.
(This article was written by one of our staff writers, James Harrington. Visit our Meet the Team page to learn more about the author and their expertise.)