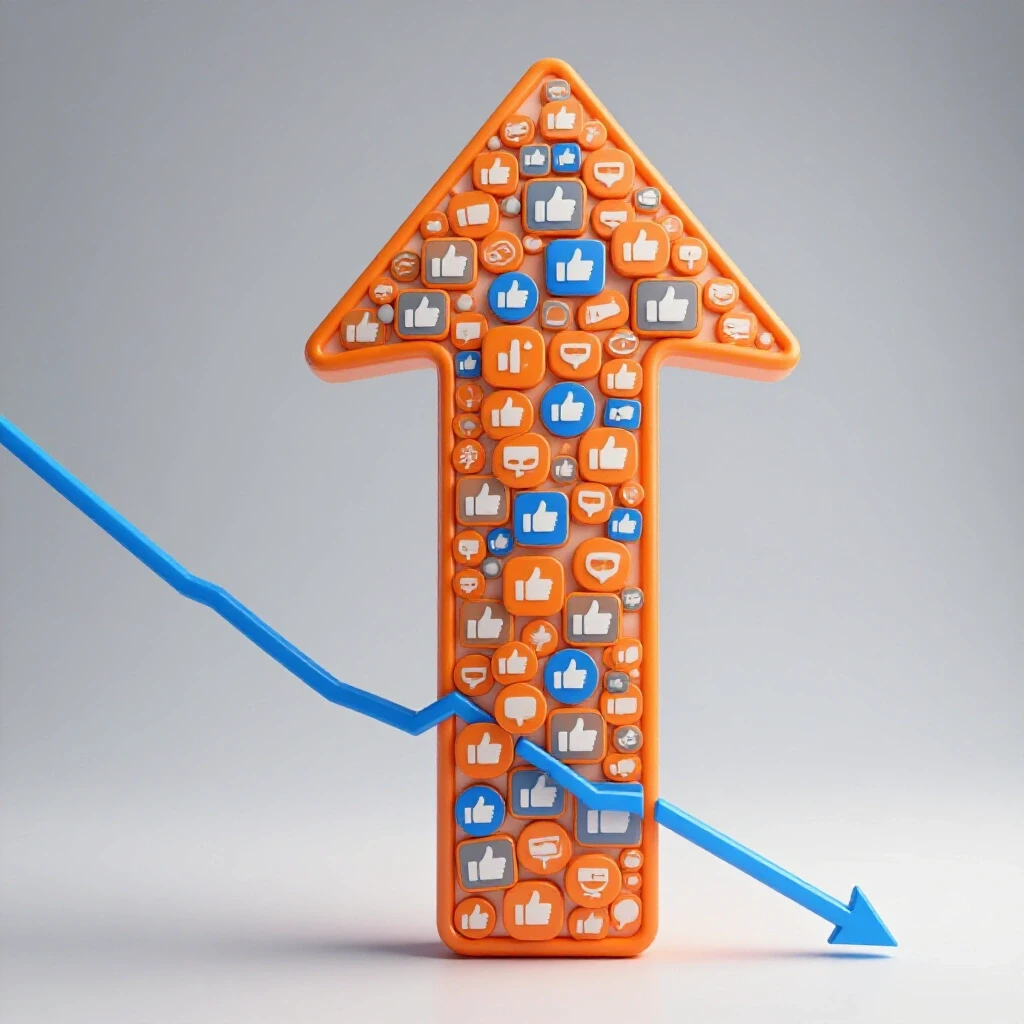
Social Media Campaign Metrics to Stop Chasing for Growth (Guide)
Over the last 11 years, I have seen the social media landscape shift from a simple chronological feed to a complex web of algorithmic weights. My journey began with building organic accounts from zero, and since then, I have documented the full lifecycle of more than 40 account growth journeys across Instagram, TikTok, and LinkedIn. Much like making eco-conscious choices in our daily lives to reduce waste, I have learned to trim the “digital waste” from my reporting. I no longer value every data point equally because not every number contributes to a sustainable social media growth strategy.
In my early years, I felt a deep sense of panic whenever a client’s reach dropped. I would spend hours trying to “fix” a campaign that was actually performing well where it mattered. Through tracking pivots, failed experiments, and eventual breakthroughs, I realized that many of the numbers we track are just noise. Today, I focus on campaign lifecycle management that prioritizes long-term health over temporary spikes. This approach helps me manage multi-platform organic growth without the constant fear of sudden stagnation.

Redefining the Baseline: Why I Moved Away from Surface-Level Growth
This section explores the transition from tracking massive, non-specific reach to focusing on targeted audience health. It defines the difference between vanity indicators that look good on a slide deck and the actual signals that indicate a campaign is building a loyal, recurring audience for the brand.
Follower count used to be the gold standard for success. However, after managing accounts through multiple platform reach recovery phases, I found that high follower counts often mask a lack of true engagement. In one specific case study involving a mid-sized B2B firm on LinkedIn, we grew the following by 15% in one month. Despite this, the actual click-through rate to their white papers remained flat. We were attracting “ghost followers” who never intended to interact with the brand.
I stopped prioritizing total follower growth as a primary success signal. Instead, I began looking at the baseline engagement rate. This is the percentage of your current audience that interacts with your content regularly. If your followers are increasing but your baseline engagement is dropping, your account health is actually declining. You are essentially building a larger room but filling it with people who have their eyes closed.
To keep your strategy grounded, I recommend a budget allocation split that protects your core goals while allowing for discovery. I typically use a 70/20/10 rule: 70% of resources go to proven content types, 20% to experimental formats, and 10% to high-risk, high-reward concepts. This prevents ad spend waste on unproven ideas while ensuring you don’t miss out on new platform trends.
Identifying the Pivot Triggers: When Traditional Data Fails the Story
This part of the guide outlines the specific moments when a strategist must decide to change direction. It defines algorithmic reach distribution and explains why a sudden drop in views is often a signal to update creative assets rather than a sign that the entire campaign has failed.
In my experience tracking 40+ account journeys, the most common pain point is the “mid-campaign plateau.” You launch a campaign, the first 14 days look great, and then the numbers fall off a cliff. Many marketers react by increasing ad spend. I have learned that this is often a mistake. Instead of chasing a dying trend, you need to analyze the pivot triggers.
Algorithmic reach distribution is how platforms decide who sees your content based on early performance. If your initial audience retention percentages are low, the platform stops showing the post to new people. I once managed a TikTok campaign for a sustainable clothing brand where the first three videos went viral, but the fourth stalled at 200 views. By looking at the “watch time” data, we saw that people dropped off in the first two seconds. The hook was too slow.
| Pivot Trigger | Observation Period | Action Required |
|---|---|---|
| Reach Stagnation | 14 Days | Audit creative hooks and headlines |
| High CTR / Low Conversion | 21 Days | Review landing page load speed and UX |
| Declining Engagement Rate | 30 Days | Shift content pillars to address new pain points |
| High Ad Frequency | 7 Days | Refresh visual assets to prevent fatigue |
Navigating the Transition: From Pure Reach to Meaningful Retention
This section focuses on the shift toward audience retention and why “viral” reach is often a distraction. It defines ad creative fatigue thresholds and explains how to maintain a steady growth rate even when the platform’s algorithm shifts unexpectedly.
I have found that chasing “viral” reach is like trying to catch lightning in a bottle. It is not a sustainable social media growth strategy. Instead, I focus on audience retention percentages. This metric tells you how much of your video or article the audience actually consumed. According to Pew Research Center studies on digital engagement, users are becoming more selective about where they spend their time. If you can’t keep them for more than five seconds, the total reach number is a lie.
During a multi-platform campaign for a tech startup, we saw a massive spike in Instagram Reels reach. On the surface, it looked like a win. However, the average watch time was only 12% of the total video length. We were reaching millions of people, but none of them were hearing our message. We pivoted the strategy to shorter, high-impact tutorials. The reach dropped by half, but the conversion rate doubled.
This is where understanding ad creative fatigue thresholds becomes vital. This is the point where your target audience has seen your ad so many times they start to ignore it. I track this by looking for a steady increase in cost-per-click (CPC) alongside a decrease in engagement. When these two lines cross, it is time to pivot, regardless of how well the campaign performed in its first week.
Justifying Strategic Pivots to Clients Without Historical Precedent
This section provides a framework for communicating strategy changes to management or clients. It explains how to use marketing trend analysis and platform-native benchmarking to explain why a shift in focus is necessary for long-term account health.
One of the hardest parts of my job is telling a client that the metrics they love don’t matter. They want to see “likes,” but I want to show them “meaningful interactions.” To bridge this gap, I use a transition log. This is a simple document that tracks what we did, what the data showed, and why we are changing. It turns a “gut feeling” into a data-backed decision.
When I face resistance, I point to Meta’s advertising transparency reports. These reports often show that even the largest brands experience volatility. Showing a client that their stagnation is part of a broader platform reach recovery trend helps lower the stakes. It moves the conversation from “Why are we failing?” to “How are we adapting?”
I recommend using a minimum observation period of 14 to 30 days before declaring a campaign stagnant. This prevents knee-jerk reactions to daily fluctuations. If you pivot too early, you don’t have enough data to know what failed. If you pivot too late, you waste budget. Finding that sweet spot is the hallmark of a seasoned growth strategist.
Practical Frameworks for Multi-Platform Account Evaluation
This section details the specific tools and processes I use to track campaign health across different platforms. It defines multi-channel attribution and explains how to create a post-campaign analysis that actually informs the next launch.
Managing campaigns across Instagram, TikTok, and LinkedIn requires a unified view of data. I don’t rely on the platforms alone because they often “over-attribute” success to themselves. Multi-channel attribution is the process of determining which platform actually drove the final action. I have seen LinkedIn ads get the credit for a sale that actually started with a TikTok organic video three weeks prior.
To keep my campaigns on track, I use a specific set of tools and checklists. These help me maintain a consistent social media growth strategy even when I am managing multiple client portfolios.
- Platform-Native Insights: I check these daily for immediate red flags like ad rejection or sudden reach drops.
- Third-Party Analytics Dashboards: Tools like Sprout Social or Hootsuite help me see the “big picture” across all accounts.
- Custom KPI Trackers: I use a simple spreadsheet to track weekly variances in baseline engagement rates.
- Creative Audit Logs: A folder where we save every ad version to track which visual styles have the longest shelf life.
- Competitor Transparency Tools: Using the TikTok Creative Center or Meta Ad Library to see if our stagnation is industry-wide.
A Pre-Campaign Audit Checklist for Sustainable Growth
Before launching any new journey, I run through this checklist. It ensures that we aren’t just chasing numbers, but building a foundation for real results.
- Define the Core Goal: Is this for brand awareness (reach) or direct action (conversions)?
- Set Variance Parameters: What is an acceptable drop in reach (e.g., 15%) before we trigger a pivot?
- Audit Creative Assets: Do we have at least three variations of every hook to test against the algorithm?
- Establish Baseline Metrics: What were the average engagement and conversion rates for the last 30 days?
- Verify Tracking Pixels: Are the conversion events firing correctly on all platforms?
Conclusion: Moving Forward with Data-Backed Confidence
The reality of social media marketing is that the rules change every day. After 11 years and 40+ account journeys, I have learned that the most successful strategists are not the ones who never fail. They are the ones who recognize failure early and have the data to back up their next move. By moving away from misleading performance markers and focusing on audience retention and baseline health, you can stop fearing the algorithm.
Your next step should be to look at your current reports. Identify one metric that looks good but doesn’t actually help your client’s bottom line. Start the conversation about why that number might be a distraction. Use the pivot trigger analysis to set clear boundaries for your next campaign. This transparency will not only protect your ad spend but also build deeper trust with your stakeholders.
Frequently Asked Questions
Why should I stop focusing on total follower count?
Follower count is often a vanity metric because it does not guarantee reach. Due to algorithmic reach distribution, only a small percentage of your followers see your content. Focusing on baseline engagement rates—the percentage of active followers who interact—is a better indicator of account health and long-term sustainability.
How do I know if a reach drop is an algorithm shift or bad content?
Check your audience retention percentages. If people are stopping to watch but the platform isn’t showing it to more people, it may be an algorithm shift or a shadow-ban issue. If people are scrolling past immediately, your creative hook is likely the problem. Compare your data with industry benchmarks to see if the trend is widespread.
What is a “pivot trigger” in a social media campaign?
A pivot trigger is a pre-defined data point that signals a need for change. For example, if your click-through rate (CTR) drops below your 30-day average for more than seven consecutive days, that is a trigger to refresh your ad creative. Setting these early prevents emotional decision-making.
How long should I wait before changing a stagnant campaign?
I recommend a minimum observation period of 14 to 30 days for organic campaigns and 7 days for paid ads. This allows the platform’s machine learning to exit the “learning phase” and provides enough data to identify genuine trends rather than daily volatility.
What is the 70/20/10 budget rule?
This is a resource allocation strategy where 70% of your budget goes to “safe” content that consistently performs. 20% goes to experimental content (new formats or platforms), and 10% goes to high-risk ideas. This balance protects your core growth while allowing for the breakthroughs found in failed experiments.
How can I justify a strategy shift to a client who only cares about likes?
Use a transition log to show the correlation between “likes” and actual business outcomes. If likes are up but conversions are down, you can demonstrate that the current engagement is not from the target audience. Back your claims with Meta’s transparency reports or Pew Research data to show broader market shifts.
What is ad creative fatigue?
Ad creative fatigue happens when your target audience has seen your content so frequently that they stop noticing it. You can spot this when your frequency metric rises while your engagement and CTR decline. Refreshing visuals or changing the hook can often “reset” the performance without changing the entire strategy.
Why is multi-channel attribution important?
Multi-channel attribution helps you understand the full customer journey. A user might see a TikTok video, search for you on LinkedIn, and finally buy through an Instagram ad. Without attribution, you might incorrectly assume TikTok isn’t working and cut the budget for your most effective top-of-funnel channel.
What are baseline engagement rates?
A baseline engagement rate is the average level of interaction your content receives during a “normal” period. It serves as a benchmark for all future campaigns. If a new campaign falls significantly below this baseline, it is a clear signal that the content is not resonating with your core audience.
How do I handle sudden stagnation in a previously successful account?
First, perform a creative audit. Often, stagnation is caused by repeating the same format for too long. Next, check for platform-wide updates or outages. If the content is still high-quality but reach is low, consider a “pattern interrupt”—a piece of content that is drastically different from your usual style to re-engage the algorithm.
(This article was written by one of our staff writers, Michael Reynolds. Visit our Meet the Team page to learn more about the author and their expertise.)