How Landing Page Changes Improve Social Media Ad ROAS (Guide)
The gray clouds outside my office today match the mood of most marketing managers looking at their rising customer acquisition costs. It has been raining for three days straight, a steady drizzle that reminds me of how small, persistent leaks in a sales funnel can eventually sink a budget. In my twelve years of managing ad spend across Meta, TikTok, and LinkedIn, I have learned that the weather is often more predictable than an algorithm update. However, while we cannot control the platforms, we can control where we send the traffic.
Managing a multi-channel advertising budget requires a thick skin and a love for spreadsheets. I remember a specific quarter where our Meta ROAS dropped by 40% overnight after a privacy rollout. My client was frantic, demanding to know why their “perfect” ads were suddenly failing. The truth was that the ads were fine, but the destination was no longer doing its job in a world with shorter tracking windows. This led me to a series of tests focused on the post-click experience, which eventually changed how I view cross-platform performance.
Establishing a Multi-Channel Advertising Budget for Scale
A multi-channel advertising budget is the strategic distribution of funds across different social platforms to minimize risk and maximize reach. Instead of putting all resources into one basket, managers spread spend based on where specific audience segments congregate. This approach requires a deep understanding of how each platform contributes to the overall marketing efficiency ratio (MER).
When I start a new campaign, I usually follow a 50-30-20 rule. I put 50% of the budget into a core, proven platform like Meta. I allocate 30% to a secondary channel like LinkedIn or TikTok to find new pockets of customers. The final 20% goes toward emerging channels or experimental creative strategies. This balance prevents a single platform’s volatility from destroying the entire month’s social media ad ROI.
Setting up this budget involves more than just picking numbers. You must look at your customer acquisition cost (CAC) targets and work backward. If your target CAC is $50 and your average order value is $150, you have a clear ceiling for your bidding strategies. I always tell my team that a budget without a target CPA is just a donation to a tech company. We use these benchmarks to justify every dollar spent to our stakeholders.
- Core Platform (50%): High volume, stable conversion rates.
- Secondary Platform (30%): Strategic growth and audience diversification.
- Experimental (20%): Testing new hooks, landing page layouts, or niche platforms.
Why Post-Click Alignment is the Key to Social Media Ad ROI
Social media ad ROI measures the financial return generated from paid campaigns relative to the amount spent on those platforms. It is a vital metric for proving the value of marketing efforts to executives. While click-through rates show interest, ROAS and ROI prove business viability by tracking actual revenue generated from those clicks.
In my testing, I found that the biggest drain on ROI wasn’t the ad creative itself. It was the “disconnect” that happened the moment a user left the social app. For example, if a TikTok ad is high-energy and fast-paced, but the landing page is a slow, corporate-looking wall of text, the user bounces immediately. This friction kills your conversion rate and spikes your customer acquisition cost.
I recently ran a test where we modified the destination page to mirror the specific visual style of the ad. For the TikTok traffic, we used vertical video testimonials and a “mobile-first” simplified checkout. For LinkedIn, we swapped those out for white papers and professional case studies. By aligning the post-click experience with the user’s mindset on that specific platform, we saw a significant lift in blended ROAS across the entire account.
Bridging the Gap Between Platform Hype and Conversion Reality
Cross-platform performance refers to the comparative analysis of how different social media channels deliver results for the same business goal. It involves looking past “vanity metrics” like likes or shares to see which platform actually drives bottom-line growth. Understanding these differences helps managers decide where to scale and where to cut spend.
Interestingly, what works on Instagram rarely translates perfectly to X or LinkedIn. I once managed a campaign for a high-end software tool. On Meta, the ads were visual and benefit-driven, leading to a respectable 3x ROAS. However, when we used those same ads on LinkedIn, the performance was abysmal. The audience there wanted data and professional validation, not lifestyle imagery.
The “change” that saved that campaign was a simple adjustment to the landing page’s header. We changed the headline to match the specific “pain point” mentioned in the ad for each platform. This created a seamless transition for the user. It showed me that ad spend justification becomes much easier when you can prove that you are catering to the specific psychology of each platform’s user base.
Measuring Cross-Platform Performance and Attribution Windows
An ROI tracking framework is a structured system used to collect, analyze, and report on the financial outcomes of advertising campaigns. It typically includes tools like conversion APIs, UTM parameters, and third-party attribution software. This framework allows managers to see the full customer journey from the first click to the final sale.
One of the hardest parts of my job is dealing with attribution windows. Meta might claim a sale happened because of a “view-through” (someone saw the ad but didn’t click), while TikTok claims the same sale because of a “click-through.” This is why I rely heavily on Blended ROAS or MER. Blended ROAS is your total revenue divided by your total ad spend across all channels. It is the only “source of truth” that doesn’t lie.
To maintain a clear ROI tracking framework, I recommend a weekly audit of your platform data versus your internal sales data. If your platforms are reporting $100,000 in sales but your bank account only shows $70,000, you have an attribution gap. We use first-party data loops to feed conversion information back into the ad managers, which helps the algorithms find better customers over time.
| Platform | Typical CTR | Target CPA | Blended ROAS Goal | Attribution Window |
|---|---|---|---|---|
| Meta | 1.0% – 1.5% | $40.00 | 3.0x | 7-day click, 1-day view |
| TikTok | 0.7% – 1.2% | $30.00 | 2.5x | 7-day click |
| 0.4% – 0.6% | $110.00 | 2.0x | 30-day click | |
| X (Twitter) | 0.8% – 1.0% | $25.00 | 1.5x | 14-day click |
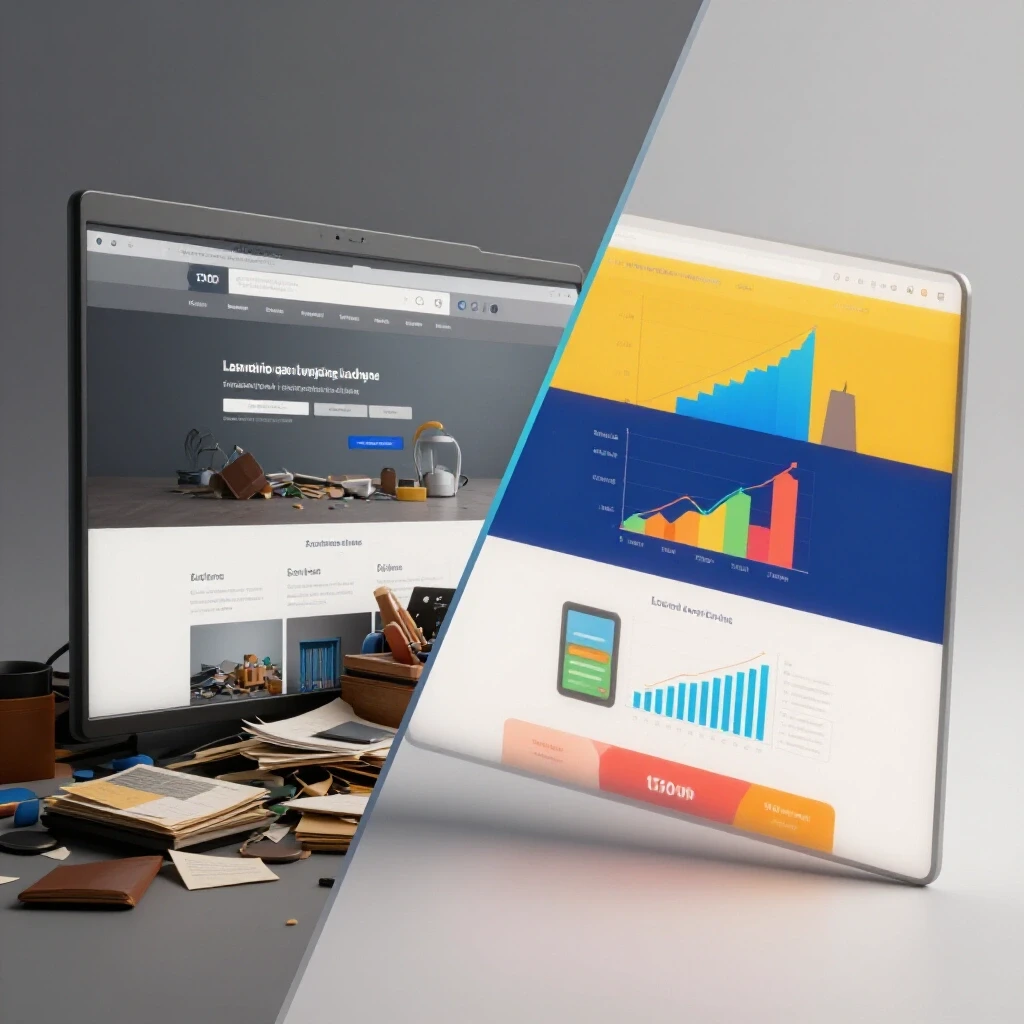
Practical Steps for Optimizing Destination Pages to Boost ROAS
Optimizing a destination page involves making data-driven changes to a website to increase the percentage of visitors who take a desired action. This process includes testing headlines, layouts, and call-to-action buttons to see what resonates best with the audience. The goal is to improve post-click conversion efficiency and lower the overall cost per lead.
During my most successful test, I focused on a concept I call “Message Match.” I noticed that our ads were promising a “5-minute setup,” but the landing page mentioned a “comprehensive onboarding process.” This small wording difference created doubt. By changing the landing page to lead with the “5-minute” promise, our conversion rate jumped by 18% in one week.
Another vital change involved removing the top navigation bar. When people click an ad, they should have one job: to convert. Giving them links to your “About Us” page or “Blog” just gives them an exit ramp. We treated the landing page like a focused conversation. This shift in layout, combined with faster loading speeds, significantly improved our social media ad ROI by keeping the user focused on the offer.
- Match the Headline: Ensure the first thing the user reads on the page is exactly what they saw in the ad.
- Remove Navigation: Kill the headers and footers to keep the user in the sales funnel.
- Speed Up the Load: Use compressed images and clean code to ensure the page loads in under two seconds.
- Add Platform-Specific Social Proof: Use testimonials that mirror the audience of the referring platform.
Resolving Platform Attribution Gaps with First-Party Data
First-party data loops are systems where a business uses its own collected customer information to improve ad targeting and tracking. Instead of relying on cookies from third parties, the business uses its own CRM data or purchase history. This is a “privacy-first” way to ensure that your ad platforms are getting accurate feedback on which clicks turned into customers.
In the current landscape, relying on a platform’s “pixel” is no longer enough. I have seen cases where Meta misses up to 30% of conversions due to browser restrictions. To fix this, we implemented a Conversion API (CAPI). This sends server-side data directly to the platform, bypassing the browser’s limitations. This change alone helped us justify a 20% increase in our multi-channel advertising budget because we could finally see the true results.
Building these loops takes time, but it is the only way to survive in a cookieless world. When the algorithm knows exactly who bought your product, it gets smarter. It stops wasting money on “looky-loos” and starts finding people who have a high lifetime value (LTV). This is the secret to maintaining a profitable customer acquisition cost over the long term.
- Implement Server-Side Tracking: Move away from browser-only pixels.
- Use a Post-Purchase Survey: Ask customers “Where did you hear about us?” to catch missing attribution.
- Sync CRM Data: Upload your customer lists to create better “Seed Audiences” for lookalikes.
Preparing Executive Dashboards for Ad Spend Justification
Ad spend justification is the process of demonstrating the financial validity of marketing expenses to stakeholders or clients. It involves presenting data that links ad costs to specific business outcomes like revenue, lead quality, and market share. A strong justification relies on clear, transparent reporting that avoids “marketing fluff.”
When I present to a board, I don’t talk about “engagement” or “reach.” I talk about the “Efficiency Gap.” This is the difference between our current ROAS and the ROAS we need to hit our profit targets. By showing them how our landing page changes narrowed this gap, I can secure more budget for future tests. I use a simple dashboard that highlights three main numbers: Total Spend, Blended ROAS, and New Customer Growth.
If you are an agency founder, your clients want to know one thing: “If I give you $1, is it coming back as $3?” I use color-coded charts to show performance by funnel stage. This helps them understand that some spend is for “Top of Funnel” awareness (which has a lower immediate ROAS) and some is for “Bottom of Funnel” conversion (which should have a high ROAS).
- Total Spend: The raw amount invested across all platforms.
- Blended ROAS: The total revenue divided by total spend.
- MER (Marketing Efficiency Ratio): Total revenue divided by total marketing spend.
- CPA (Cost Per Acquisition): The average cost to acquire one new customer.
Strategic Scaling and Bid Management
Bidding and scaling strategies are the methods used to increase ad spend while maintaining a profitable return. Scaling can be “horizontal” (adding more audiences or platforms) or “vertical” (increasing the budget on existing winning ads). Bid management involves choosing between automated bidding, cost caps, or manual bids to control how much you pay for each action.
I have seen many managers make the mistake of doubling their budget the moment they see a good ROAS. This usually breaks the algorithm and sends the CPA through the roof. I prefer a “slow-drip” scaling method. We increase the budget by 10-15% every three days, provided the ROAS remains stable. This gives the platform time to find more people within the target price range.
For our landing page tests, we used “Cost Caps” to ensure we didn’t overpay for traffic while the new pages were being “seasoned.” Once the conversion rate on the new page stabilized, we switched to “Highest Volume” bidding to capture as much market share as possible. This transition is a delicate dance, but it is necessary for long-term growth.
- Identify the Winner: Only scale ads that have a ROAS above your “break-even” point.
- Incremental Increases: Raise budgets by 15% max to avoid resetting the learning phase.
- Monitor Frequency: Watch how often people see your ads; if it gets too high, your ROAS will drop.
- Diversify Creative: When scaling, introduce new ad formats to prevent “creative fatigue.”
Conclusion and Next Steps for Your Campaigns
Improving your return on ad spend is rarely about finding a “magic” button in the Ads Manager. It is about the disciplined alignment of your multi-channel advertising budget with a post-click experience that actually converts. My journey from chasing vanity metrics to focusing on unit economics was a hard one, but it made me a better marketer.
If you want to start seeing better results today, stop looking at your ads and start looking at your destination pages. Ask yourself if the person who clicked that TikTok ad feels “at home” when they land on your site. If the answer is no, you are leaving money on the table. Start with one small change—perhaps matching your headline to your best-performing ad—and watch how the data shifts.
- Review your current blended ROAS across all social channels.
- Identify the landing page with the highest bounce rate.
- Implement a “Message Match” test on that page this week.
- Set up a basic Conversion API to improve your data accuracy.
Frequently Asked Questions
What is the most important metric for multi-channel success?
The most important metric is Blended ROAS (or MER). Because platform-specific attribution is often flawed due to privacy settings and cross-device usage, looking at your total revenue divided by your total spend gives you the most honest view of your marketing health.
How do I know if my landing page is the reason for a low ROAS?
Check your “Click-to-Landing-Page-View” ratio and your “Landing-Page-Conversion” rate. If many people click the ad but never see the page, your site is too slow. If they see the page but don’t convert, there is likely a disconnect between the ad’s promise and the page’s content.
Should I use the same landing page for TikTok and LinkedIn?
Ideally, no. The user intent on these platforms is very different. TikTok users expect fast, visual, and informal content. LinkedIn users often require more data, social proof, and professional context. Tailoring the page to the platform usually results in a higher conversion rate.
What is a “good” ROAS for a social media campaign?
A “good” ROAS depends entirely on your profit margins. For a high-margin digital product, a 2.0x ROAS might be very profitable. For a low-margin physical product, you might need a 4.0x or 5.0x ROAS to break even. Always calculate your “Break-Even ROAS” before launching.
How long should I run a landing page test before making changes?
You should wait until you have a statistically significant amount of data, which usually means at least 100 conversions per variation. In terms of time, I recommend at least 7 to 14 days to account for daily fluctuations in traffic quality and user behavior.
Does site speed really affect my Facebook ad performance?
Yes, significantly. Meta tracks “Landing Page Views,” and if your site takes more than 3 seconds to load, many users will bounce before the pixel even fires. This results in wasted spend and a lower ROAS because the algorithm can’t learn from those “lost” visitors.
What is the difference between ROAS and MER?
ROAS (Return on Ad Spend) is usually calculated within a specific platform (like Meta). MER (Marketing Efficiency Ratio) is a “blended” view that takes all marketing spend into account against total revenue. MER is often more accurate for high-level business planning.
How can I justify a higher ad budget to my boss?
Focus on the “marginal CPA.” Show them that as you have scaled spend, the cost to acquire a customer has remained stable or decreased. Use your ROI tracking framework to prove that the “lifetime value” of these customers far exceeds the cost of the ads.
Why does my platform data never match my Shopify or CRM data?
This is due to “attribution windows” and privacy blockers. Platforms use different rules for when to “claim” a sale. Using a first-party data loop and a server-side Conversion API is the best way to narrow this gap and get closer to the truth.
What is the biggest mistake marketers make when scaling?
The biggest mistake is scaling too fast and breaking the “learning phase” of the algorithm. Another common error is scaling a winning ad without checking if the landing page can handle the increased traffic or if the offer is still relevant to a broader audience.
(This article was written by one of our staff writers, James Harrington. Visit our Meet the Team page to learn more about the author and their expertise.)