How to Rebuild Your Social Media Ad Structure for Better ROI (Guide)
There is a common belief in the paid media world that if your performance is dipping, you just need to find a new “winning” interest group or a secret lookalike audience. Many buyers spend their weeks chasing tiny tweaks in targeting, hoping the algorithm will suddenly find a pocket of cheap conversions. In reality, the problem is rarely the audience; it is usually a fractured account structure that prevents the algorithm from learning.
For years, I followed the “more is better” approach. I would have dozens of campaigns running at once, each with narrow targeting and small budgets. I thought I was being precise. Instead, I was just making it impossible for my platforms to gather enough data to optimize. Last year, I hit a wall where my customer acquisition cost (CAC) on Meta and TikTok jumped by 35% in a single month. I realized that my complex setup was the very thing killing my margins. I spent the following thirty days stripping everything back and rebuilding my entire approach from the ground up.

Establishing a New Financial Foundation for Multi-Channel Success
This phase involves setting the financial rules of engagement before you touch a single button in Ads Manager. You must define what a “win” looks like using hard numbers that exist outside of the platform’s often-inflated dashboards. This foundation ensures that every dollar spent has a clear purpose and a measurable path toward profitability.
When I started my 30-day account pivot, I had to stop looking at the ROAS (Return on Ad Spend) reported by Meta. It was often 20% higher than what our bank account showed. I shifted my focus to the Marketing Efficiency Ratio (MER), which is your total revenue divided by your total ad spend. This metric provides a “blended” view that accounts for the fact that a user might see an ad on TikTok but eventually buy through a Google search.
Table 1: Cross-Platform Performance Benchmarks (Pre-Restructure)
| Platform | Avg. CPM | Avg. CTR | Platform ROAS | Blended ROAS (MER) |
|---|---|---|---|---|
| Meta | $18.50 | 0.95% | 2.8x | 1.9x |
| TikTok | $9.20 | 1.10% | 1.5x | 1.2x |
| $45.00 | 0.40% | 1.2x | 1.0x |
Defining Blended ROAS and Marketing Efficiency Ratio (MER)
Blended ROAS is a calculation that looks at your total sales across all channels compared to your total ad spend. It ignores which platform “claims” the credit and focuses on the actual cash flow of the business. This prevents you from over-investing in a platform that reports high numbers but doesn’t drive new growth.
I learned this the hard way when a client demanded I double the budget on LinkedIn because the platform showed a 4x ROAS. When we did, our total company revenue didn’t move an inch. The platform was simply claiming credit for people who were already going to buy. By switching to an MER-first model, I could see that our multi-channel advertising budget was being wasted on “bottom-of-funnel” traps.
Reorganizing the Campaign Hierarchy to Reduce Audience Overlap
This step focuses on moving from a fragmented account with many small ad sets to a consolidated structure. By reducing the number of moving parts, you allow the platform’s machine learning to exit the “learning phase” faster. This leads to more stable costs and more predictable performance over the long term.
During my month of restructuring, I deleted nearly 70% of my active ad sets. I moved from “Interest-Based” targeting to “Broad” targeting on Meta and TikTok. I stopped trying to outsmart the algorithm and instead gave it the freedom to find customers based on the creative I was feeding it. This was terrifying at first, but within 14 days, my cost-per-acquisition (CPA) stabilized for the first time in months.
- Consolidation: Combine similar audiences into one large bucket to increase the data density per ad set.
- CBO/Advantage+: Let the platform decide which ad set gets the budget based on real-time performance.
- Exclusions: Remove existing customers from your top-of-funnel campaigns to ensure you are only paying for new customer acquisition.
Understanding the Learning Phase and Data Density
The learning phase is the period after you launch an ad when the platform is still figuring out who to show it to. Most platforms require about 50 conversions per week per ad set to exit this phase. If your budget is spread too thin across too many ad sets, you will stay in the learning phase forever.
Staying in the learning phase is expensive. During my restructuring, I realized I had five different ad sets all competing for the same “Eco-friendly” audience. They were driving up each other’s costs. By merging them into one “Broad” ad set with a higher budget, I reached the 50-conversion threshold by Wednesday each week. This single move dropped my Meta CAC by 22% almost overnight.
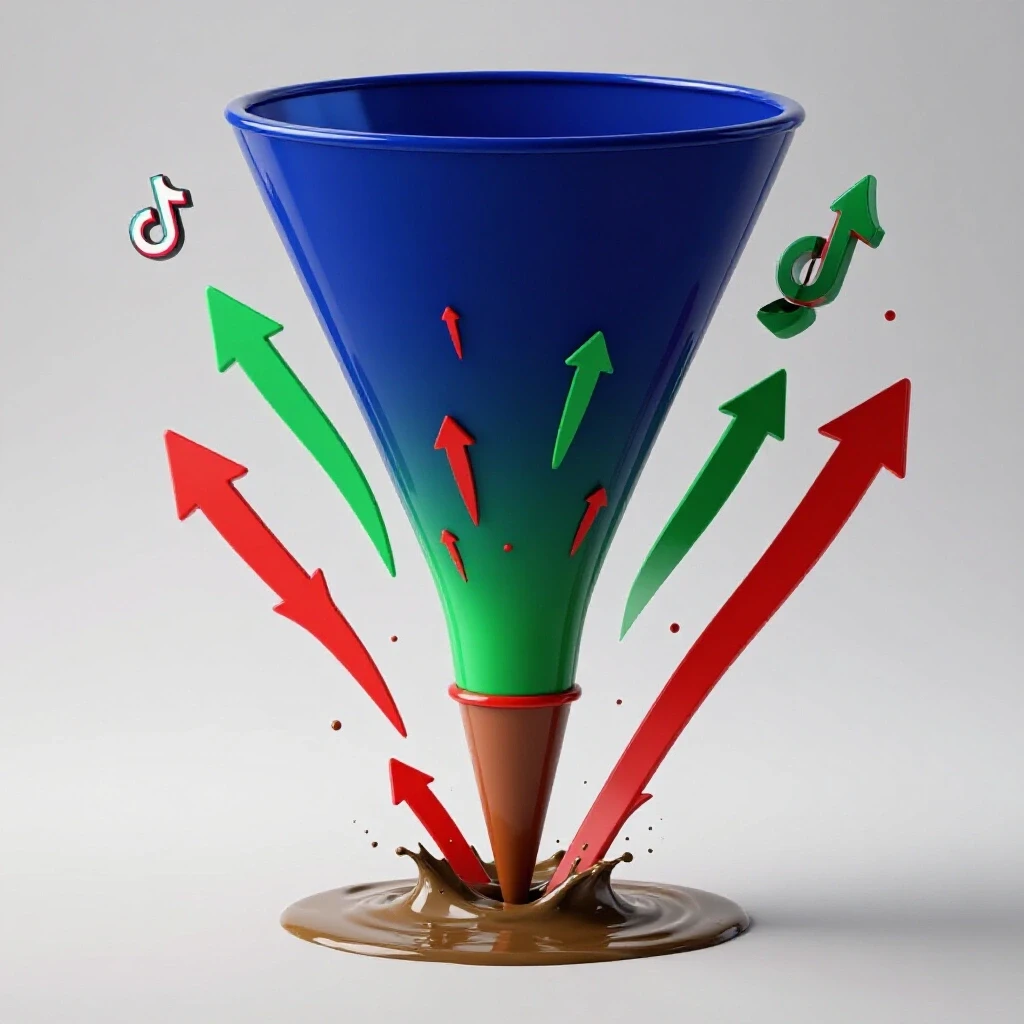
Executing Creative Variations Across Meta, TikTok, and LinkedIn
This process involves creating specific assets that match the “vibe” and user behavior of each individual platform. Rather than using one video for everything, you tailor the hook, the format, and the call to action to fit where the user is scrolling. This ensures your ads feel like native content rather than intrusive interruptions.
During the 30-day overhaul, I stopped treating TikTok like a “cheaper version of Facebook.” I started filming raw, lo-fi content for TikTok while keeping the more polished, brand-heavy videos for Instagram. For LinkedIn, I focused on thought-leadership style image ads. This cross-platform performance strategy helped us maintain a consistent message while respecting the “unwritten rules” of each social network.
Table 2: Creative Performance by Funnel Stage
| Creative Type | Primary Platform | Target CTR | Primary Metric |
|---|---|---|---|
| UGC (User Content) | TikTok / Reels | 1.5% – 2.0% | Hook Rate (3s) |
| Static Product Shot | Meta / Pinterest | 0.8% – 1.2% | Conversion Rate |
| Case Study / PDF | 0.4% – 0.6% | Lead Quality | |
| Short-Form Brand | X / YouTube Shorts | 1.0% | View-Through Rate |
Measuring Hook Rates and Hold Rates
The “Hook Rate” is the percentage of people who watch the first three seconds of your video. The “Hold Rate” is the percentage of people who stay until the end. These metrics tell you if your creative is actually interesting to your audience, regardless of whether they buy right away.
I use these metrics to justify my ad spend to stakeholders. If a TikTok ad has a 40% hook rate but a low conversion rate, I can prove that the creative is good, but the landing page might be the problem. This level of detail helps move the conversation away from “the ads aren’t working” to “we need to fix the checkout process.” It changes the dynamic from blame to problem-solving.
Solving the Attribution Gap with Privacy-First Tracking
This section addresses the difficulty of tracking sales in a world where cookies are disappearing and privacy settings are increasing. By using server-side tracking and first-party data, you can get a clearer picture of where your sales are coming from. This reduces the “data blackout” that often happens with standard browser tracking.
One of the biggest stresses during my month of rebuilding was the discrepancy between my Shopify dashboard and my Meta Ads Manager. Meta would claim 10 sales, but Shopify only showed 6. I implemented a Conversion API (CAPI) and started using UTM parameters religiously. This didn’t give me 100% accuracy—nothing does anymore—but it brought the data gap down to a manageable 10%.
- Conversion API (CAPI): Sends data directly from your server to the ad platform, bypassing browser blockers.
- UTM Framework: A standardized way of naming your links so you can track the exact campaign, ad set, and creative in Google Analytics.
- Post-Purchase Surveys: Asking customers “How did you hear about us?” to catch the “dark social” conversions that tracking software misses.
- First-Party Data Loops: Using your email list to create “Seed Audiences” for the platform to find similar new customers.
The Outcome: A 30-Day Analysis of Efficiency Gains
This is the final review where you compare your new, simplified structure against the old, complex one. You look at the total business impact, not just the numbers in the ad account. The goal is to see if your changes resulted in a more sustainable and profitable way to grow the business.
At the end of my 30-day restructuring, the results were clear. While my “Platform ROAS” actually looked lower on paper, my total company profit was higher. Because I had consolidated my spend, I was no longer wasting money on overlapping audiences. My team spent less time “button-pushing” and more time on creative strategy. We had built a system that could actually scale without breaking.
Table 3: Post-Restructure Efficiency Comparison
| Metric | Before Overhaul | After Overhaul | % Change |
|---|---|---|---|
| Blended CAC | $42.00 | $33.00 | -21% |
| Weekly Creative Tests | 2 | 8 | +300% |
| Time Spent Managing | 15 hours/wk | 4 hours/wk | -73% |
| Blended ROAS (MER) | 1.9x | 2.4x | +26% |
Tools and Frameworks for Long-Term Profitability
Managing a multi-channel advertising budget requires more than just the platforms themselves. You need a stack of tools that help you aggregate data and visualize the “truth” of your performance. These tools allow you to justify your decisions to clients or executives with confidence.
- Triple Whale or Northbeam: These are attribution softwares that help you see the “customer journey” across different platforms.
- Supermetrics: A tool that pulls data from all your ad accounts into a single Google Sheet or Looker Studio report.
- Motion: A creative analytics tool that turns complex ad data into visual charts that your creative team can actually understand.
- Forecasting Spreadsheets: I use custom sheets to predict where my CAC will be in three months based on current spend levels.
Summary of Key Takeaways
- Simplify to Scale: A consolidated account structure almost always outperforms a fragmented one because it provides more data to the algorithm.
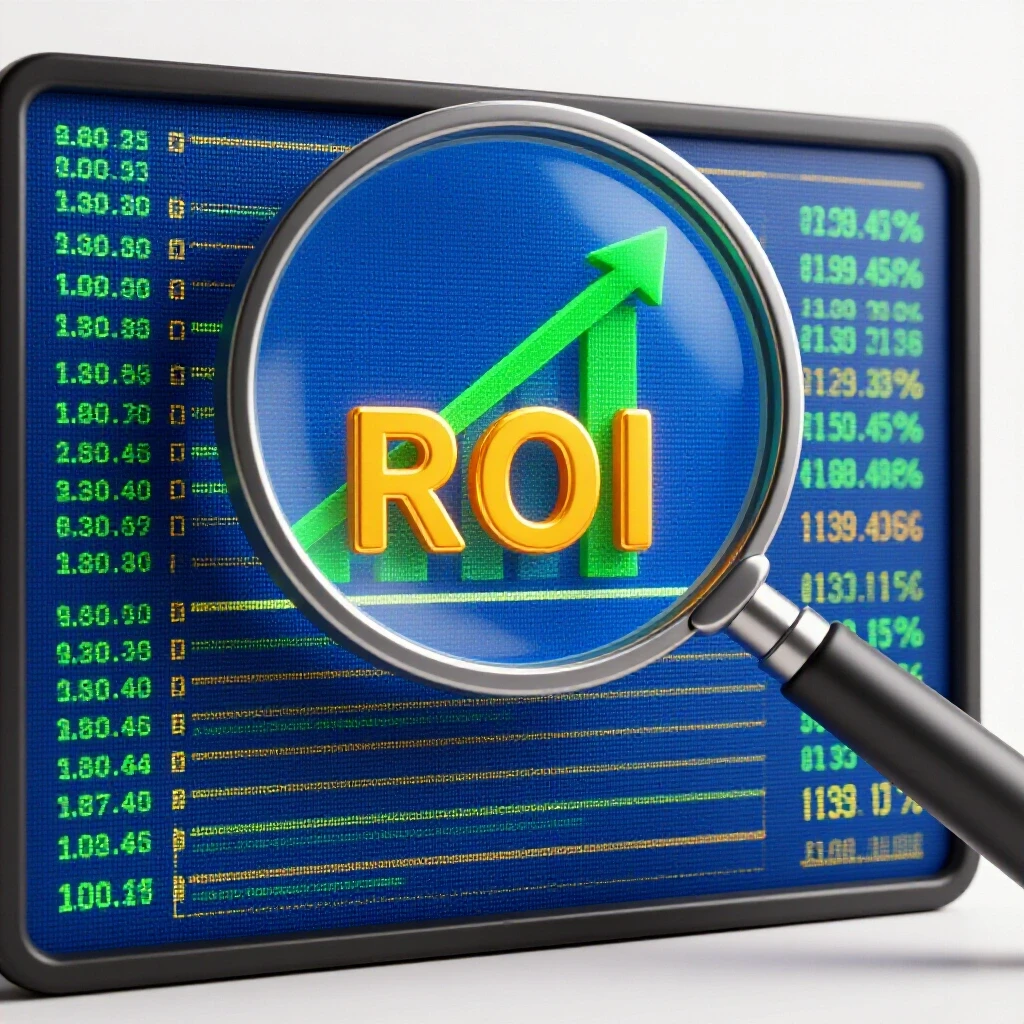
- Focus on MER: Don’t trust platform-reported ROAS blindly; look at your total revenue versus total spend to find your true ROI tracking framework.
- Creative is the Variable: Since targeting is becoming more automated, your ability to produce platform-native creative is your biggest competitive advantage.
- Expect Data Gaps: No tracking system is perfect. Use a combination of CAPI, UTMs, and surveys to get the most complete picture possible.
- Test, Don’t Guess: Use your saved time from account management to run more creative tests and find what truly resonates with your audience.
Frequently Asked Questions
What is the “Learning Phase” and why does it matter? The learning phase is the period where a platform’s algorithm gathers enough data to optimize your ad delivery. If you don’t get enough conversions (usually 50 per week), the platform never learns who your best customer is. This results in fluctuating costs and poor performance. Avoiding frequent changes to your ads helps you exit this phase faster.
How do I justify a lower platform ROAS to my boss? Explain the concept of “Blended ROAS” or MER. Show them that while one platform might look like it’s performing worse, the total company revenue is growing more efficiently. Use a post-purchase survey to prove that the “low ROAS” platform is actually the first place customers discover the brand.
Is interest targeting dead on Meta and TikTok? It isn’t dead, but it is much less effective than it used to be. Modern algorithms are better at finding your audience by “reading” your ad creative than by following your manual targeting instructions. Moving to “Broad” targeting often results in lower CPMs and more stable long-term scaling.
How often should I change my ad creative? You should test new creative as soon as your current “winners” start to show signs of fatigue, such as rising CPAs or falling CTRs. For most brands spending over $5,000 a month, this means launching 2-3 new creative concepts every single week.
What is the best way to track ads after the iOS 14 updates? The best approach is a “triangulation” method. Use the platform’s Conversion API (CAPI), clean UTM parameters in Google Analytics, and a third-party attribution tool. Combining these three sources gives you a much clearer picture than relying on any single one.
Should I use the same video on TikTok and Instagram Reels? While you can, it’s better to tweak them. TikTok users prefer more “raw” and “unfiltered” content with native text overlays. Instagram users generally respond better to slightly higher production value. Even changing the music or the first three seconds can make a big difference in performance.
What is a “good” Hook Rate for a video ad? A healthy Hook Rate (people watching the first 3 seconds) is usually between 25% and 35%. If your hook rate is below 20%, your ad is being scrolled past, and it doesn’t matter how good the rest of the video is. You need to change the first three seconds immediately.
How much of my budget should go to testing? I recommend the 70/20/10 rule. 70% of your budget goes to “proven” winners, 20% goes to testing new creative for those winners, and 10% goes to “wildcard” tests on new platforms or completely new audience concepts. This ensures you are always finding the next big winner.
(This article was written by one of our staff writers, James Harrington. Visit our Meet the Team page to learn more about the author and their expertise.)