How to Fix Social Media Ads That Fail Despite a Great Product (Guide)
There is a specific kind of hollow feeling that settles in your chest when you realize a campaign has burned through a five-figure budget with nothing to show for it. I remember sitting in a glass-walled conference room three years ago, staring at a Meta Ads dashboard that was a sea of red. We were selling a revolutionary ergonomic chair that had won design awards and had glowing customer reviews. On paper, it was the perfect product, yet the ads were failing to convert. I had to explain to a frustrated CEO why our customer acquisition cost was three times the product’s price. That experience taught me that even the best products can fail in the auction if the underlying economics and platform-specific strategies are misaligned.

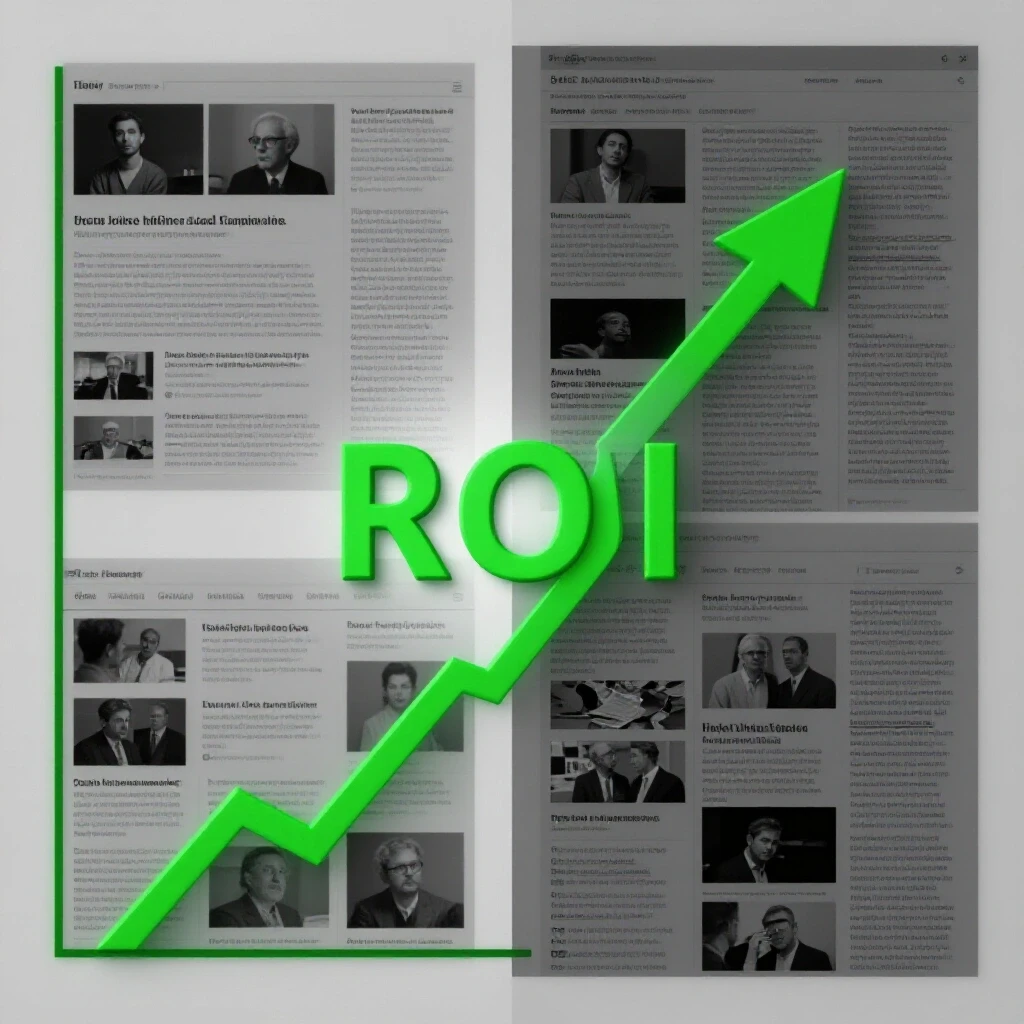
Establishing a Resilient ROI Tracking Framework
An ROI tracking framework is a structured system used to measure the financial success of ad spend across multiple channels. It moves beyond platform-specific metrics to look at how every dollar contributes to the bottom line, ensuring that marketing efforts align with actual business growth and cash flow requirements.
When I manage a multi-channel advertising budget, I no longer rely solely on the “Return on Ad Spend” (ROAS) reported by individual platforms. After the privacy updates of recent years, those numbers are often inflated or incomplete. Instead, I focus on the Marketing Efficiency Ratio (MER), which is your total revenue divided by your total ad spend. This gives a “blended” view that accounts for the reality that a customer might see an ad on TikTok, click a link on LinkedIn, and finally buy through a Google search.
To build a framework that justifies your spend to stakeholders, you must define your “North Star” metrics before a single ad goes live. For most of my clients, this involves a three-tier approach: 1. Platform ROAS (for daily tactical adjustments) 2. Blended CPA (to monitor overall business health) 3. Customer Lifetime Value (to determine how much we can actually afford to pay for a lead)
In my experience, the biggest mistake is treating every platform’s data as the absolute truth. I’ve managed accounts where Meta claimed a 4.0 ROAS, but the bank account showed the company was losing money. By using a blended model, you can see the cross-platform performance more clearly and avoid the trap of over-investing in a channel that looks good on paper but doesn’t drive actual profit.
Defining Blended Acquisition Costs and MER
Blended acquisition cost is the total marketing spend divided by the total number of new customers acquired across all channels. Unlike platform-specific CPA, this metric provides a holistic view of how your entire marketing engine is performing, regardless of which platform claims the final credit for the sale.
When I explain this to executive boards, I use the analogy of a basketball team. One player might score the point, but three others touched the ball to make it happen. If you only reward the person who shoots, you lose the teamwork that creates the opportunity. This is why understanding your total customer acquisition cost is vital. If your Meta CPA is $50 and your TikTok CPA is $70, but your blended CPA is $45, it means your multi-channel presence is creating a lift that individual platform trackers are missing.
- Blended ROAS Target: Usually 3.0 or higher for healthy e-commerce.
- Target CPA Limit: Must be at least 20% below your gross margin per unit.
- First-Party Data Loop: Using your own email lists to verify platform attribution.
Why Fragmented Platform Data Skews ROI Calculations
Fragmented platform data occurs when different advertising networks use unique tracking methods that do not communicate with each other. This leads to “double-counting” conversions or missing them entirely, making it difficult for managers to see the true path a customer takes before making a purchase.
I once managed a campaign across Instagram, TikTok, and LinkedIn simultaneously. At the end of the month, if I added up the conversions reported by each manager, we supposedly had 1,200 sales. However, the Shopify store only showed 800. This discrepancy happens because each platform wants to take credit for the sale to justify your multi-channel advertising budget. If a user saw an ad on all three platforms and then bought, all three platforms might claim that conversion.
To solve this, I implement a “truth-first” reporting model. This involves setting up a centralized dashboard that pulls data directly from the storefront and the ad platforms. We then apply a “discount factor” to platform-reported ROAS. For example, if I know Meta typically over-reports by 20%, I adjust my targets accordingly. This level of honesty with the data is what allows for a realistic ad spend justification when reporting to clients.
Resolving Platform Attribution Gaps with Conversion APIs
A Conversion API (CAPI) is a tool that allows businesses to send web events from their server directly to an advertising platform. This bypasses browser-based tracking, which is often blocked by ad blockers or privacy settings, providing a more reliable stream of data for campaign optimization.
In the early days, we relied on “pixels” or small pieces of code on a website. Today, those pixels are often blocked. I’ve seen campaign performance drop by 40% overnight simply because a browser updated its privacy settings. By setting up a server-to-side connection, I can ensure that the platform receives the data it needs to optimize its bidding. Without this, the algorithm is “flying blind,” which is a primary reason why ads fail even when the product is excellent.
- Set up Meta Conversion API via a gateway or direct integration.
- Implement TikTok Events API to capture mobile-first interactions.
- Use LinkedIn’s Enhanced Conversions to track professional lead paths.
- Verify all events through a 7-day click and 1-day view attribution window.
Cross-Platform ROI Benchmarks and Performance Data
Platform benchmarks are average performance metrics, such as click-through rates and costs per click, collected across thousands of advertisers. These figures serve as a baseline to help media buyers determine if their specific campaigns are performing above or below the industry standard.
When I evaluate why a campaign isn’t scaling, I look at how it compares to the broader market. If my LinkedIn ads have a 0.4% click-through rate (CTR) but the industry average is 0.6%, I know my creative isn’t resonating with the professional audience. Below is a comparison of typical benchmarks I’ve observed across different business objectives.
| Platform | Avg. CTR | Avg. CPC | Primary Objective | Best Funnel Stage |
|---|---|---|---|---|
| Meta (FB/IG) | 0.90% – 1.20% | $0.60 – $1.20 | Direct Sales | Full Funnel |
| TikTok | 1.50% – 2.10% | $0.20 – $0.50 | Brand Awareness | Top of Funnel |
| 0.40% – 0.60% | $5.00 – $12.00 | B2B Lead Gen | Mid/Bottom Funnel | |
| X (Twitter) | 0.50% – 0.80% | $0.40 – $0.90 | Real-time Traffic | Top of Funnel |
Aligning Creative Execution with Platform User Behavior
Creative execution refers to the process of designing and producing the visual and written elements of an ad. To be effective, the creative must match the specific “vibe” and technical requirements of the platform where it is being shown, rather than using a one-size-fits-all approach.
One of the hardest lessons I learned was that you cannot simply “copy and paste” an ad from Instagram to TikTok. I once ran a high-production, cinematic video for a skincare brand on TikTok. It looked beautiful, but it failed miserably. Why? Because TikTok users value “lo-fi” authenticity. The ad looked like an ad, so people swiped past it immediately. When we re-shot the same content on an iPhone in a bathroom, the performance tripled.
To avoid ad delivery challenges, I follow a strict platform-specific creative strategy: * Meta: High-quality imagery with clear value propositions in the first 3 seconds. * TikTok: User-generated content (UGC) style that feels like a native post. * LinkedIn: Professional, data-driven insights or “how-to” guides that offer value. * X: Short, punchy text with timely hooks or controversial questions to spark engagement.
By tailoring the message to the medium, you reduce the friction between the user and the product. Even a “great product” feels like an intrusion if the ad doesn’t respect the environment it lives in.
Managing Creative Fatigue in High-Spend Campaigns
Creative fatigue happens when an audience has seen an ad too many times, leading to a decrease in engagement and an increase in costs. It is a natural part of the ad lifecycle that requires constant monitoring and the introduction of fresh visual assets.
I track this by watching the “Frequency” metric in my dashboard. If the frequency hits 3.0 or 4.0 within a week, it means the same people are seeing the ad over and over. This is a common reason for rising customer acquisition costs. To combat this, I maintain a “creative pipeline.” At any given time, I have 5 to 10 new variations ready to swap in. This isn’t just about changing the image; it’s about testing different “hooks” or emotional angles.
Bidding and Scaling Strategies for Sustained Growth
Bidding strategies are the rules you set for how much you are willing to pay for a specific action, like a click or a sale. Scaling involves increasing your budget in a way that maintains profitability without confusing the platform’s learning algorithm.
In my decade of managing budgets, I’ve found that many managers scale too fast. They see a good day and double the budget. This usually resets the “learning phase” of the algorithm, causing performance to tank. I prefer a “slow and steady” approach. I increase budgets by no more than 20% every 48 to 72 hours. This allows the platform to find more people similar to the ones who already converted without spiking the auction price.
- Lowest Cost Bidding: Best for finding the most volume at the current budget.
- Bid Caps: Useful when you have strict margins and cannot afford to go over a certain CPA.
- Cost Caps: A middle ground that helps keep the average cost stable while allowing for some flexibility.
I once worked with a client who insisted on using “Lowest Cost” bidding for a luxury watch brand. Because the product was expensive, the algorithm struggled to find enough buyers, leading to erratic spending. We switched to a “Cost Cap” strategy, telling the platform we wouldn’t pay more than $150 per sale. The volume dropped initially, but the profitability stabilized, proving that more spend isn’t always better.
Preparing Executive Dashboards for Budget Justification
An executive dashboard is a simplified, visual report that highlights key performance indicators for decision-makers. It strips away the technical jargon and focuses on the financial outcomes that matter to the business, such as total spend, total revenue, and net profit.
When I present to a board, I don’t talk about “Click-Through Rates” or “CPM.” They don’t care. They want to know if the $100,000 they gave me turned into $300,000. My dashboards are designed to answer three questions: 1. How much did we spend? 2. What did we get for it? 3. Where is the most efficient place to put the next dollar?
To build these, I use tools like Google Looker Studio or specialized ad aggregators. I include a “Trend Line” that shows the blended ROAS over the last 90 days. This helps the executive team see that even if one week was bad, the overall trajectory is positive. It builds trust and makes it much easier to ask for a budget increase when the data is clear and professional.
Essential Tools for Multi-Channel Management
Managing several platforms at once requires a centralized tech stack to maintain sanity and data integrity. Over the years, I have narrowed my toolkit down to these five essentials:
- Triple Whale or Northbeam: For advanced attribution and real-time MER tracking.
- Google Looker Studio: For creating custom, client-facing dashboards.
- Supermetrics: To automate the pull of data from various ad managers into spreadsheets.
- Motion: To analyze creative performance and share visual insights with design teams.
- Slack/Asana: For managing the creative pipeline and communication between stakeholders.
Practical Steps to Diagnose and Fix Underperforming Ads
If you have a great product but your ads are failing, you need a systematic way to find the leak. I use a “diagnostic checklist” that starts at the top of the funnel and works its way down. Usually, the problem is not the product itself, but a breakdown in the “bridge” between the ad and the checkout page.
First, I look at the CTR. If it’s low, the hook is weak. Second, I look at the Landing Page Conversion Rate. If people are clicking but not buying, the website is the problem. Third, I look at the CPM (Cost Per Thousand Impressions). If this is unusually high, the targeting is too narrow or the creative is being penalized by the platform for poor quality.
- Check 1: Is the “Hook” grabbing attention in under 3 seconds?
- Check 2: Does the ad copy match the landing page headline exactly?
- Check 3: Is the checkout process longer than 3 steps?
- Check 4: Are you retargeting people who added to cart but didn’t buy?
By isolating these variables, you can turn a failing campaign into a profitable one without guessing. It turns the “stress of maintaining ROAS” into a manageable engineering problem.
Conclusion: Building a Path to Long-Term Profitability
Success in paid media is rarely about a single “hack” or a perfect button color. It is about understanding the actual economics of social advertising and being disciplined with your budget. I have learned that the most successful managers are those who stay grounded in data, remain transparent about the difficulties of tracking, and never stop testing.
If your ads are currently underperforming, don’t panic. Start by calculating your blended MER. Look at your creative through the lens of the platform user. Adjust your bidding to protect your margins. Most importantly, remember that every “failed” campaign is actually a paid lesson in what your audience doesn’t want. Use that data to refine your next move, and you will eventually find the path to scaling that your product deserves.
Frequently Asked Questions
What is the most common reason ads fail for high-quality products? The most frequent cause is a “Creative-Platform Mismatch.” This happens when the ad’s style doesn’t fit the user’s behavior on that specific platform. For example, using a formal LinkedIn-style video on TikTok often leads to high skip rates. Even a great product won’t sell if the ad looks out of place or “too corporate” for a casual social environment.
How do I know if my customer acquisition cost (CPA) is too high? Your CPA is too high if it exceeds your “Break-Even Point,” which is your gross margin per unit. If you sell a product for $100 and it costs $40 to make and ship, your margin is $60. If your CPA is $65, you are losing $5 on every sale. Ideally, your target CPA should be at least 20-30% below your margin to allow for business overhead and profit.
What is a “Blended ROAS” and why should I care? Blended ROAS (or MER) is your total revenue divided by your total ad spend across all platforms. It is vital because modern privacy settings make it impossible for any single platform to track 100% of sales. Blended ROAS gives you the “big picture” of whether your marketing efforts are actually making the company money, regardless of which platform claims the credit.
Should I use automatic bidding or manual bid caps? For most advertisers, automatic bidding (Lowest Cost) is the best way to start because it allows the platform’s algorithm to learn. However, as you scale and your margins get tighter, manual bid caps or cost caps can help prevent the platform from overspending during expensive auction times, such as holidays or weekends.
How often should I change my ad creatives? This depends on your budget and “Frequency” metric. If your target audience is seeing the same ad more than 3 or 4 times a week, you will likely see performance drop due to creative fatigue. For high-spend accounts, I recommend testing at least 2-3 new creative concepts every week to keep the algorithm fed with fresh content.
How do I justify a budget increase to my boss if the ROAS is fluctuating? Focus on the “Blended” metrics and the “Customer Lifetime Value” (LTV). Show them that while Meta’s ROAS might be down this week, the overall cost to acquire a customer remains profitable when looking at the total business. Explain that scaling is a long-term play to increase the total number of customers who will buy again in the future.
What is the “Learning Phase” in Meta or TikTok ads? The learning phase is a period when the platform’s algorithm is gathering data to determine who is most likely to click or buy. During this time (usually the first 50 conversions), performance can be very unstable. It is a rookie mistake to change your ads or budget during this phase; you must let the algorithm finish its “education” before making judgments.
Why is my “Add to Cart” rate high but my “Purchase” rate low? This usually indicates a “friction” problem at the end of the funnel. It could be unexpected shipping costs, a complicated checkout form, or a lack of trust signals (like reviews or secure payment icons). Your ads are doing their job by bringing people to the site, but the website is failing to close the deal.
How many platforms should I be on at once? I recommend mastering one “Core” platform (where 50% of your budget goes) before diversifying. Once you have a stable, profitable flow on one channel, move 20% of your budget to a “Secondary” platform. Trying to manage 5 platforms at once with a small team often leads to “mediocre” performance across all of them rather than “excellent” performance on one.
Is retargeting still effective after the iOS 14 privacy changes? Yes, but it has changed. Instead of relying purely on website visitors, you should focus on “In-Platform Retargeting.” This means showing ads to people who watched 50% of your video or interacted with your Instagram page. This data is “first-party” to the platform and is much more accurate than tracking people across different websites.
(This article was written by one of our staff writers, James Harrington. Visit our Meet the Team page to learn more about the author and their expertise.)