Which Social Media Platform Supports Evergreen Campaigns (Guide)
Talking about waterproof options, I often think about how we build marketing campaigns. Just as a raincoat needs to hold up against more than a light drizzle, a brand’s digital presence must survive the constant shifts in the social landscape. In my ten years managing diverse portfolios, I have seen platforms rise and fall, but the real challenge for any manager is finding the places where a single dollar spent today continues to work for you a year from now. We are moving away from the era of “viral spikes” and entering a period where stability and predictable returns are the only metrics that matter to the executive board.

Defining Parameters for Sustainable Social Media Success
This involves establishing clear benchmarks to measure how well a platform supports content that continues to perform months or years after the initial launch date.
When we talk about durability in digital marketing, we are looking at the shelf-life of a post or an ad. On many platforms, a post is “dead” within 24 hours. However, certain networks function more like libraries than newsfeeds. I have managed accounts where a video produced in 2018 still generates 15% of the monthly lead volume. This is what I call a “low-decay” environment.
To evaluate these platforms, we must look at platform-native retention signals. These are the ways a platform’s code decides to show your old content to new people. If a platform relies solely on a chronological feed, your content has a short life. If it relies on search intent or interest-based clusters, your content can live much longer.
Mapping Demographics for Long-Term Engagement
Analyzing the age, intent, and behavior of users on specific networks ensures your messaging aligns with where they spend their time over the long haul.
Understanding who is on the platform is the first step in justifying your budget. According to research from the Reuters Institute, older demographics (35–55) are more likely to stay loyal to a platform like Facebook or LinkedIn, while younger audiences are more fragmented. If your goal is to build a foundation that lasts, you need to follow the users who have established habits.
- Facebook: Remains the dominant force for the 35–65+ demographic. It is excellent for community building and long-term retargeting.
- LinkedIn: The primary hub for B2B. Users here have a high intent to learn or network, making it a stable place for professional thought leadership.
- YouTube: Acts as the world’s second-largest search engine. It is the gold standard for content that stays relevant because people search for solutions, not just “new” posts.
- Pinterest: A visual discovery engine where users plan for the future (weddings, home builds, etc.), giving content a very long lead time.
| Platform | Primary Age Group | User Intent | Content Shelf-Life |
|---|---|---|---|
| YouTube | 18–65+ | Educational/Entertainment | Years |
| 25–45 | Planning/Discovery | Months to Years | |
| 28–55 | Professional Growth | Weeks | |
| 35–65+ | Social/Community | Days to Weeks | |
| 18–45 | Visual Inspiration | Hours to Days |
Why Search-Driven Platforms Offer the Highest Content Longevity
Evaluating how networks like YouTube and Pinterest function more like search engines allows older assets to resurface based on user queries rather than chronological feeds.
I once worked with a home improvement brand that was frustrated with Instagram. They were posting beautiful photos, but the engagement dropped to zero after 48 hours. We shifted 40% of their budget to Pinterest and YouTube. Within six months, their “How to Install Tile” video from month one was their top traffic driver.
This happens because of “search intent.” When a user types a query into a search bar, the platform looks for the most relevant answer, not the newest one. This is a “platform comparison analysis” that many managers miss. We often chase the newest features while ignoring the “searchable” nature of older ones. For a manager, this means you can justify a higher production budget because the asset isn’t disposable.
The Role of Professional Stability in B2B Performance
Examining LinkedIn’s ability to maintain lead quality and professional relevance through its structured ad environment and high-intent user base.
LinkedIn is often criticized for its high cost-per-click (CPC). In my experience, a $10 CPC on LinkedIn often yields a higher ROI than a $1 CPC on a broader platform. This is due to “audience demographic trends.” On LinkedIn, you aren’t just targeting an age; you are targeting a job title, a company size, and a professional history.
The platform’s “Saved Audiences” feature allows us to build a profile of a “perfect buyer” and keep them in a loop of relevant content. Because the professional world moves slower than the consumer world, a well-crafted white paper or case study can remain effective for 12 to 18 months. I recommend a “social channel optimization” strategy here that focuses on solving a specific industry pain point rather than following a weekly trend.
Balancing Meta’s Machine Learning with Creative Fatigue
Managing the trade-off between Facebook’s powerful automated targeting and the tendency for visual assets to lose effectiveness quickly in fast-moving feeds.
Facebook and Instagram are the “workhorses” of digital advertising, but they suffer from high creative fatigue. Creative fatigue is when your audience has seen your ad so many times they stop clicking, causing your costs to rise. To maintain a durable presence here, you must use “platform-native ad placements” like the Advantage+ setups, which allow the algorithm to test different combinations of your assets.
Interestingly, Facebook’s retargeting structures are some of the most robust in the industry. By using a “pixel” (a piece of code on your site), you can show ads to people who visited your site months ago. This creates a “cross-platform marketing” funnel where a user might find you on YouTube through a search and then see your brand on Facebook until they are ready to buy.
Strategic Budget Allocation and Performance Reporting
A framework for distributing funds across channels based on their historical ability to drive conversions without requiring constant manual intervention.
When I present to a board, I use a “60/40 split” rule. 60% of the budget goes to “Lead Channels”—these are the stable, search-based, or high-intent platforms like LinkedIn and YouTube. These are your “waterproof” options. The remaining 40% goes to “Secondary Support” channels like Instagram or Facebook to drive awareness and keep the brand “top of mind.”
- Lead Channels (60%): Focus on high-value conversions and long-term search traffic.
- Support Channels (40%): Focus on retargeting and maintaining brand frequency.
To track this, look at the “organic-to-paid engagement ratio.” If your organic content is still getting clicks months later, you have found a durable platform. If your traffic stops the second you turn off the ads, you are on a “treadmill” platform.
Practical Frameworks for Managing Multi-Channel Portfolios
Step-by-step guides and toolsets designed to help marketing managers streamline their reporting and justify platform choices to executive stakeholders.
To manage this fragmentation, you need a unified way to look at data. I suggest using a “cross-channel conversion parameter” system. This means using UTM codes (special tags at the end of a URL) that tell you exactly which platform—and which specific post—sent the lead, even if it happened three months after the post was published.
- Audit Your Content Library: Identify which posts from last year are still getting clicks.
- Map Intent to Platform: Match your “educational” content to YouTube and your “transactional” content to Facebook.
- Set Benchmark CTRs: Aim for a 0.5% to 1.5% Click-Through Rate (CTR) on evergreen ads.
- Monitor Video Retention: On YouTube, aim for at least 30% of viewers to still be watching at the 30-second mark.
- Use a Unified Dashboard: Tools like Google Looker Studio or Funnel.io can pull data from all platforms into one view.
Troubleshooting Metric Discrepancies and ROI
Understanding why different platforms report different numbers and how to find the “single source of truth” for your marketing reports.
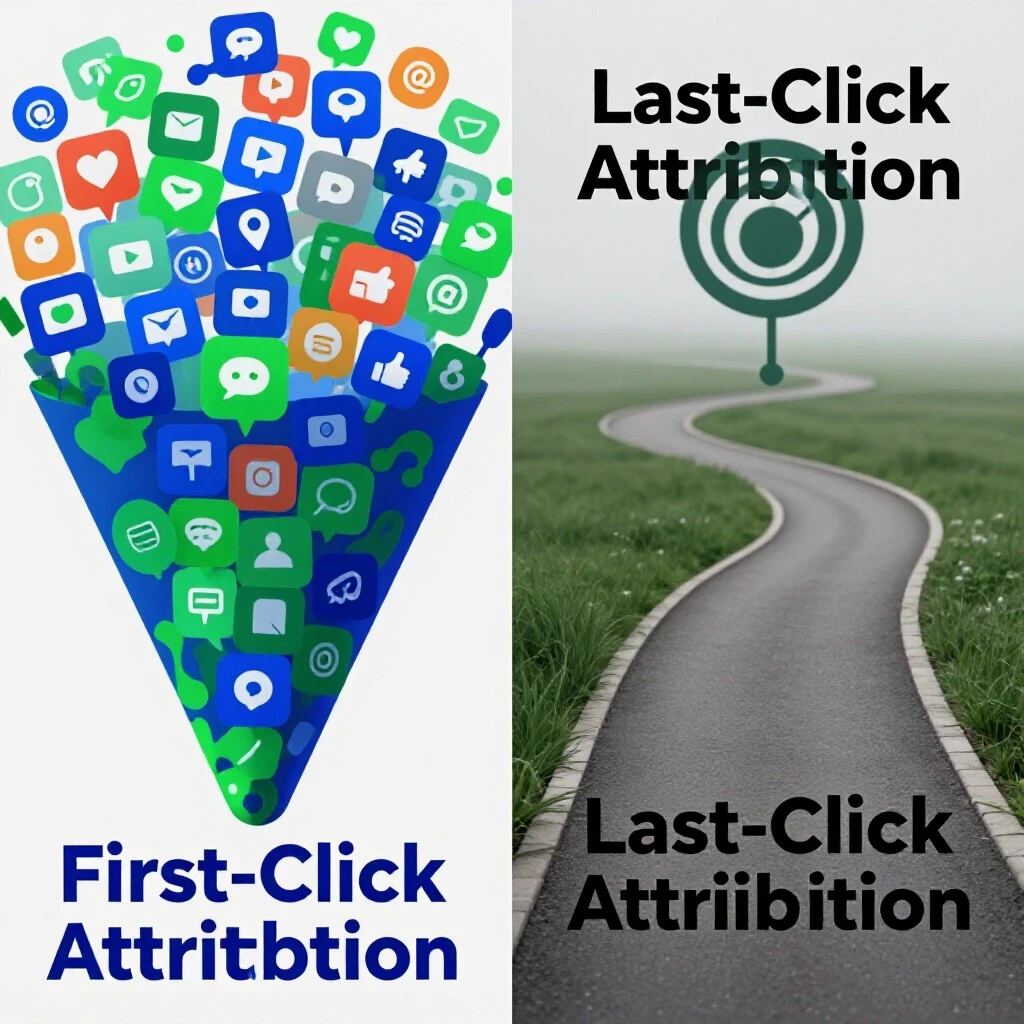
One of the biggest pain points I hear from managers is that Facebook says they had 100 sales, but Google Analytics says they had 50. This is due to “attribution windows.” Facebook might count a sale if someone saw an ad but didn’t click, while Google only counts it if they clicked.
To solve this, I focus on “actual business outcomes.” Does the total revenue in the bank account go up when we increase the budget on a specific platform? By looking at “longitudinal platform algorithm updates,” we can see that platforms are moving toward “privacy-first” tracking. This means we must rely more on our own internal data and less on the “perfect” tracking the platforms promise.
Actionable Tracking Framework for Long-Term Campaigns
This checklist helps ensure your campaign is built to last before you ever hit “publish.”
- Asset Durability Check: Is this content tied to a specific date or season? If yes, it is not evergreen.
- Search Optimization: Does the title and description include keywords people actually search for?
- Retargeting Setup: Is the pixel active and are the “custom audiences” populating correctly?
- Budget Guardrails: Have you set a maximum Cost-Per-Lead (CPL) that you are willing to pay?
- Feedback Loop: Are you checking the “post-view” conversions every 30 days to see the long-tail effect?
Building a Resilient Marketing Portfolio
In my decade of testing, the most successful managers are those who don’t panic when an algorithm changes. They succeed because they have built a diversified portfolio. They have “waterproofed” their strategy by putting their best assets on platforms that value depth over speed.
As you move forward, look at your current budget. If 90% of your money is in “fast-decay” feeds, you are at risk. Start by moving 10% to a search-based or professional platform. Watch the data over six months. You will likely find that while the initial “buzz” is lower, the total ROI over time is much stronger. This is how you justify your choices to a board: by showing them a foundation that doesn’t wash away when the trends change.
FAQ
What is the average shelf-life of a post on different platforms? On Twitter (X), a post lasts about 15–20 minutes. On Facebook, it’s about 5–6 hours. Instagram posts remain relevant for about 21 hours. However, on Pinterest, a “Pin” can drive traffic for up to 4 months, and a YouTube video can remain relevant for years if it ranks for a specific search term.
How do I justify the higher cost of LinkedIn ads to my CEO? Focus on “lead quality” rather than “lead quantity.” LinkedIn allows for precise professional targeting that other platforms lack. Show the CEO the “conversion-to-sale” rate. If 10% of LinkedIn leads turn into customers compared to 1% from Facebook, the higher initial cost is actually a better investment.
Which platform is most resistant to algorithm updates? YouTube and Pinterest are generally more stable because they are driven by user search queries. While their “recommendation” engines change, a video that answers a specific question like “How to calculate ROI” will always have a baseline of traffic regardless of feed changes.
What is a “good” video retention rate for long-form content? For a 5–10 minute video, a 30–40% average view duration is considered very healthy. If you see a sharp drop in the first 15 seconds, your intro isn’t matching the user’s search intent.
How often should I refresh “evergreen” ad creative? Even durable ads need a “refresh” every 3–6 months. This doesn’t mean changing the message, but perhaps updating the visual or the call-to-action to prevent creative fatigue among your core audience.
What is the best way to track cross-platform ROI without cookies? Use “conversion modeling” and UTM parameters. By tagging every link with specific campaign data, you can see the path a user took in your own analytics software, which is more reliable than the platform’s internal reporting.
Should I stop using platforms with short content shelf-lives? No. Platforms like Instagram are vital for “brand frequency” and keeping your audience engaged. The key is balance. Don’t rely on them for your entire lead generation strategy; use them to support your more durable channels.
What is an “organic-to-paid engagement ratio”? This is a metric that compares how much engagement you get for free versus what you pay for. If a platform has a high ratio, it means your content has “legs” and can grow without constant ad spend. If it’s low, you are in a “pay-to-play” environment.
How do I handle “fragmented audiences” across five different platforms? Create a “core” piece of content (like a long video or article) and then “atomize” it. Turn the video into a Pinterest graphic, a LinkedIn thought-leadership post, and a Facebook summary. This ensures a consistent message while respecting the “native” feel of each platform.
What is the biggest mistake managers make with long-term campaigns? The biggest mistake is “setting and forgetting.” Even a durable campaign needs a monthly check-up to ensure the “cost-per-acquisition” hasn’t spiked and that the landing page is still converting at a healthy rate.
(This article was written by one of our staff writers, Jonathan Mercer. Visit our Meet the Team page to learn more about the author and their expertise.)