Which Social Platform Grows Retail Store Visits? (Comparison Guide)
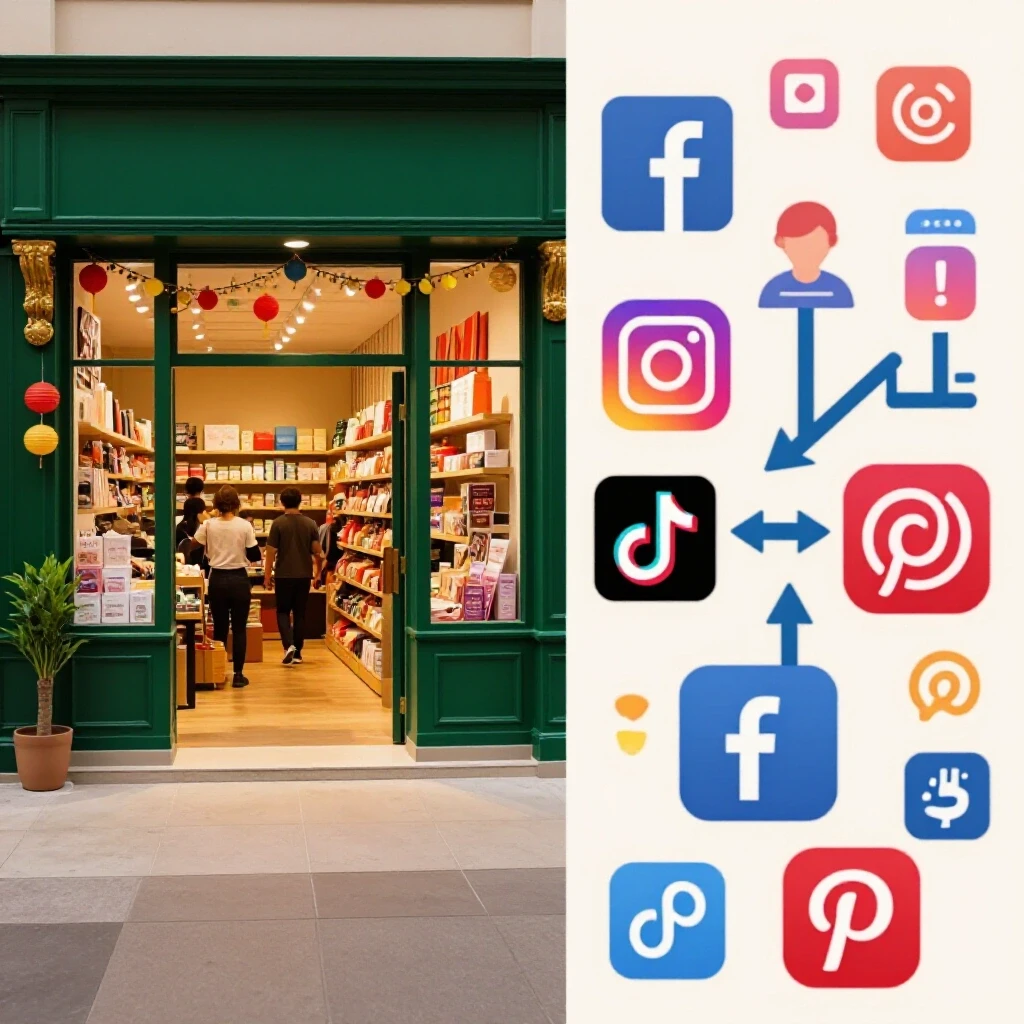
There was a time when a simple full-page spread in the Sunday paper was enough to fill the aisles of a department store. Today, that clarity has vanished, replaced by a digital landscape so fragmented that even seasoned managers struggle to see where the physical foot traffic begins. In my twelve years managing brand presence, I have watched the “path to purchase” transform from a straight line into a complex web of digital touchpoints that may or may not lead to a physical door.
Evaluating Digital Channels for Physical Store Growth
Measuring how digital spend translates into real-world foot traffic requires a shift from vanity metrics to location-based attribution. It involves looking past clicks to see how specific ad formats and mobile-first content drive customers through physical doors. Success in this area depends on understanding the “Online-to-Offline” (O2O) journey and the “Research Online, Purchase Offline” (ROPO) effect.
In my experience, the biggest mistake a retail manager can make is treating every social platform as a digital-only storefront. I once worked with a regional furniture chain that was seeing record-high engagement on their organic Instagram posts. The likes were pouring in, but the showroom floors remained quiet. When we conducted a platform comparison analysis, we realized their content was reaching a global audience of “aspirational” followers rather than local residents who could actually visit a store. We had to pivot our strategy to focus on platform-native ad placements that utilized hyper-local targeting.
This shift taught me that organic reach comparison is often a red herring for physical retailers. While organic content builds brand affinity, it rarely moves the needle for a specific store location on its own. For a retail brand to see a true offline impact, the strategy must be rooted in paid placements that use GPS and Wi-Fi signals to bridge the gap between a screen and a storefront.
Mapping Demographics to Local Shopping Habits
Demographic mapping is the process of aligning a platform’s user base with your physical store’s actual customer profile. Understanding who uses which app helps ensure your local ads reach people within a reasonable driving distance. This step is crucial for justifying budget allocations to executive boards who want to see local sales lift.
According to data from the Reuters Institute, audience demographic trends show that older, high-income earners remain tethered to Facebook, while younger, trend-driven shoppers have migrated to TikTok. This matters for retail because a luxury boutique and a fast-fashion outlet require entirely different channel strategies.
| Platform | Core Age Range | Retail Intent | Offline Tracking Maturity |
|---|---|---|---|
| 35–65+ | High (Utility/Local) | Very High | |
| 24–44 | High (Visual/Trend) | High | |
| TikTok | 18–34 | Moderate (Impulse) | Emerging |
| 25–50 | Very High (Planning) | Moderate |
When I analyze these splits, I look at the “intent” of the user. A person on Pinterest is often in a “planning” mindset, which is perfect for home improvement or bridal retail. Conversely, a TikTok user is looking for entertainment, making them more susceptible to impulse visits for food, beverage, or trendy apparel.
Why Meta Ecosystems Lead in Location-Based Attribution
Meta’s ecosystem offers robust tools for physical retailers, focusing on “Store Visit” objectives and offline conversion tracking. These features use mobile signals to estimate when a person who saw an ad actually entered a shop. This provides a level of accountability that is often missing from newer, more “viral” platforms.
Facebook and Instagram remain the workhorses of cross-platform marketing for retail. I have found that their “Store Sales” objective is one of the few tools that allows a manager to upload point-of-sale (POS) data and match it against ad impressions. This isn’t perfect—privacy changes like iOS 14.5 have made it harder—but it still provides a more reliable baseline than most.
- Store Visit Ads: These use a “Map Card” format that shows the user the nearest location, store hours, and a “Get Directions” button.
- Offline Conversions API: This allows you to connect your in-store sales data directly to your ad account to see which campaigns drove actual revenue.
- Dynamic Ads for Real-Time Inventory: You can show ads that only feature products currently in stock at the user’s local branch.
I remember a project where we used dynamic ads for a grocery chain. We only showed ads for specific regional produce when it was actually on the shelves in those specific zip codes. The result was a 12% lift in category sales compared to the previous year. This is where social channel optimization becomes a tangible business driver rather than just a marketing expense.
TikTok’s Role in Driving Impulse Foot Traffic
TikTok leverages high-energy, short-form video to create localized trends that encourage immediate physical visits. Its “Nearby” feed and location tags make it a powerful tool for capturing the attention of younger shoppers looking for local experiences. The platform excels at creating a sense of “FOMO” (fear of missing out) that translates into store visits.
While TikTok’s attribution tools are still maturing, the platform-native retention signals are incredibly strong. If a user watches a 15-second video of a local bakery three times, the algorithm knows they are interested. If that video is tagged with a location, the chance of a visit skyrockets.
However, I always caution managers about the “organic trap” on TikTok. Viral success is unpredictable. For a retail brand, I recommend a 70/30 split: 70% of the effort should go into “Spark Ads” (boosting high-performing organic content) targeted at local audiences, and 30% into raw organic experimentation. This ensures that when a video does well, it is being seen by people who can actually buy the product in person.
Using Pinterest for High-Intent Physical Purchases
Pinterest acts as a visual discovery engine where users plan future activities, including home renovations or wardrobe updates. For retail, this means capturing customers during the “planning” phase, long before they step into a showroom. It is one of the few platforms where users actively want to see “ads” because they are looking for product inspiration.
For a retail brand with a long sales cycle—like a furniture store or a kitchen remodeler—Pinterest is indispensable. The shelf-life of a Pin is months, compared to hours on X or days on Facebook. This means your “offline impact” budget works harder for longer.
- Pinterest Trends: Use this to see what people are planning to buy in your region three months in advance.
- Catalog Sales: Upload your entire inventory so users can see “Shop the Look” pins that lead to local store information.
- Visual Search: Users can take a photo of something they like and find similar items in your store.
Navigating the Challenges of Offline Attribution
Measuring offline impact is inherently difficult because of privacy changes and signal loss. Marketing managers must use a mix of platform data, third-party studies, and in-store metrics like coupon redemptions to get a clear picture of ROI. We have to accept that “perfect” data no longer exists in a post-cookie world.
In my longitudinal platform algorithm updates tracking, I have seen a steady decline in the accuracy of “last-click” attribution. If a customer sees an Instagram ad on Tuesday, a TikTok on Thursday, and visits the store on Saturday, which platform gets the credit? Most boards want a simple answer, but the reality is more nuanced.
To combat this, I suggest using “Geo-fencing” and “Store-Visit Lift” studies. A lift study takes two similar geographic areas, shows ads in one (the test group) and none in the other (the control group), and then compares the total sales. This is the gold standard for proving that your social spend is actually working.
Formulating a Cross-Channel Budget for Regional Success
A balanced budget distributes funds based on the specific role each platform plays in the customer journey. Usually, this means splitting spend between broad awareness and hyper-local, direct-response ads that mention specific store locations. I typically advise a “Lead and Support” model for retail brands.
- Lead Channel (60% of budget): This is usually Meta (Facebook/Instagram) due to its superior local targeting and store-visit tools.
- Secondary Support (30% of budget): This is either TikTok (for impulse/youth) or Pinterest (for high-intent planning).
- Experimental (10% of budget): This is for testing new features, like YouTube Shorts or local influencers.
When I managed a national apparel brand, we found that by moving 15% of the budget from “general awareness” to “local store traffic” objectives, we decreased our cost-per-store-visit by 22%. It wasn’t about spending more; it was about spending with geographic intent.
Practical Frameworks for Measuring Real-World Results
These frameworks are sets of standardized metrics and tools used to verify if digital ads are actually moving the needle in physical stores. They move beyond likes and comments to focus on store-visit lift and regional sales data. As a manager, you need a “report card” that makes sense to non-marketers.
| Metric | Definition | Retail Benchmark |
|---|---|---|
| Store-Visit Rate | % of ad viewers who visited a store | 0.5% – 2.0% |
| Cost Per Store Visit (CPSV) | Total spend divided by estimated visits | $2.00 – $10.00 (Varies by industry) |
| QR Code Redemption Rate | % of users who scanned an in-store code | 1% – 5% |
| Local CTR | Click-through rate on “Get Directions” | 0.8% – 1.5% |
To track these effectively, I recommend the following toolset:
- Google Business Profile: Essential for tracking “Get Directions” and “Call” clicks.
- Meta Events Manager: For tracking offline conversions via CSV uploads.
- Placer.ai or Near: Third-party foot traffic analytics that provide independent verification.
- Custom QR Codes: Unique codes for every platform to track which app drove the most in-store scans.
Troubleshooting Metric Discrepancies
It is common to see a high number of “Store Visits” in your ad dashboard but no corresponding increase in foot traffic on the shop floor. This often happens because platform algorithms use “probabilistic modeling”—essentially an educated guess based on GPS pings. If a store is in a busy mall, the platform might think someone visited your store when they were actually just walking past it to get a coffee.
To fix this, I look at “Average Video Watch Times” and “Engagement Ratios.” If people are watching your “Visit Us” video for less than 3 seconds, the “Store Visit” data is likely inflated. High-quality visits usually follow high-quality engagement. I also cross-reference digital data with “Old School” methods, like asking customers “How did you hear about us?” at the register. It’s simple, but it provides a reality check for the digital data.
Building a Unified Reporting System for the Board
When it comes time to justify your budget, avoid the “alphabet soup” of marketing jargon. Your executive board doesn’t care about CPMs or reach. They care about how many people walked through the door and how much they spent. I build my reports around three pillars: Cost, Volume, and Quality.
- Cost: What did we spend per physical visitor?
- Volume: How many total visitors can be attributed to our digital efforts?
- Quality: Did these visitors actually buy something (Average Order Value)?
By focusing on these outcomes, you position yourself as a business driver rather than a cost center. I once had to defend a $500,000 social budget to a skeptical CFO. Instead of showing him a slide of “viral” TikToks, I showed him a map of our 50 store locations with an overlay of sales lift in the areas where we ran “Store Visit” ads. He approved the budget in ten minutes.
Next Steps for Marketing Managers
If you are looking to optimize your offline impact today, start by auditing your current location data. Ensure every physical store has a verified Google Business Profile and a corresponding “Location” in your Meta Business Suite. Without this foundation, the most creative ad in the world won’t be able to tell you if it worked.
Next, run a small “Store-Visit Lift” test. Pick two similar stores, run ads for one, and keep the other as a control. This data will be your most powerful weapon when it comes time to ask for more budget or defend your current strategy. Remember, in retail, the only metric that truly matters is the one that happens at the cash register.
Frequently Asked Questions
Which platform is most accurate for tracking physical store visits? Meta (Facebook and Instagram) remains the most mature in this area. Their integration with mobile GPS and their ability to match POS data through the Offline Conversions API provides a higher level of confidence compared to TikTok or Pinterest. However, no platform is 100% accurate due to privacy restrictions.
How do I justify a high Cost-Per-Click (CPC) for local retail ads? In retail, a high CPC is often acceptable if the “intent” is high. A click on a “Get Directions” button is significantly more valuable than a click to a blog post. Focus the conversation on the “Cost Per Store Visit” rather than the CPC to show the true value to the board.
Does organic reach still matter for brick-and-mortar stores? Organic reach comparison shows that while organic content is great for community building, its ability to drive immediate foot traffic is limited. Think of organic as your “digital storefront window” and paid ads as the “salespeople” who go out and bring people in.
How can I track “offline” sales if I don’t have a sophisticated POS system? The simplest way is through platform-specific “offer codes” or QR codes. By offering a small discount that can only be redeemed by showing a specific digital coupon, you can manually track which platforms are driving the most customers.
What is a good benchmark for a Store-Visit Rate? While it varies by industry, a healthy Store-Visit Rate typically falls between 0.5% and 2.0%. If you are seeing rates lower than 0.1%, your targeting is likely too broad or your creative is not clearly communicating the “visit us” message.
Should I use different creative for TikTok versus Instagram for the same store? Absolutely. TikTok requires a “lo-fi,” authentic feel—often featuring actual store employees. Instagram performs better with high-quality, aesthetic visuals. Using the same “polished” ad on TikTok often leads to users scrolling past it immediately.
How does geo-fencing work for retail brands? Geo-fencing involves drawing a digital perimeter around a specific location (like your store or a competitor’s store). When a user enters that area, they become eligible to see your ads. It is a highly effective way to reach shoppers who are already in a “buying” mindset in your immediate area.
What is the “ROPO” effect and why should I care? ROPO stands for “Research Online, Purchase Offline.” It describes the behavior of customers who use social media to find products but prefer to buy them in a physical store to see, touch, or try them on. Understanding this helps you realize that a “lack of online sales” doesn’t mean your ads aren’t working.
Can I track if people visit my store after seeing a Pinterest pin? Pinterest has “Verified Merchant” programs and “Conversion Insights” that can track some offline movement, but it is less direct than Meta. Usually, you track Pinterest’s impact through “Save” rates and then look for a corresponding lift in regional sales for those specific products.
How often should I update my offline conversion data? For the best results, you should upload your in-store sales data (CSV) to platforms like Meta at least once a week. This allows the algorithm to learn in real-time which types of users are actually making purchases, helping it optimize your future ad delivery.
(This article was written by one of our staff writers, Jonathan Mercer. Visit our Meet the Team page to learn more about the author and their expertise.)