How Ignoring Key Analytics Metrics Hurts Social Media Growth (Guide)
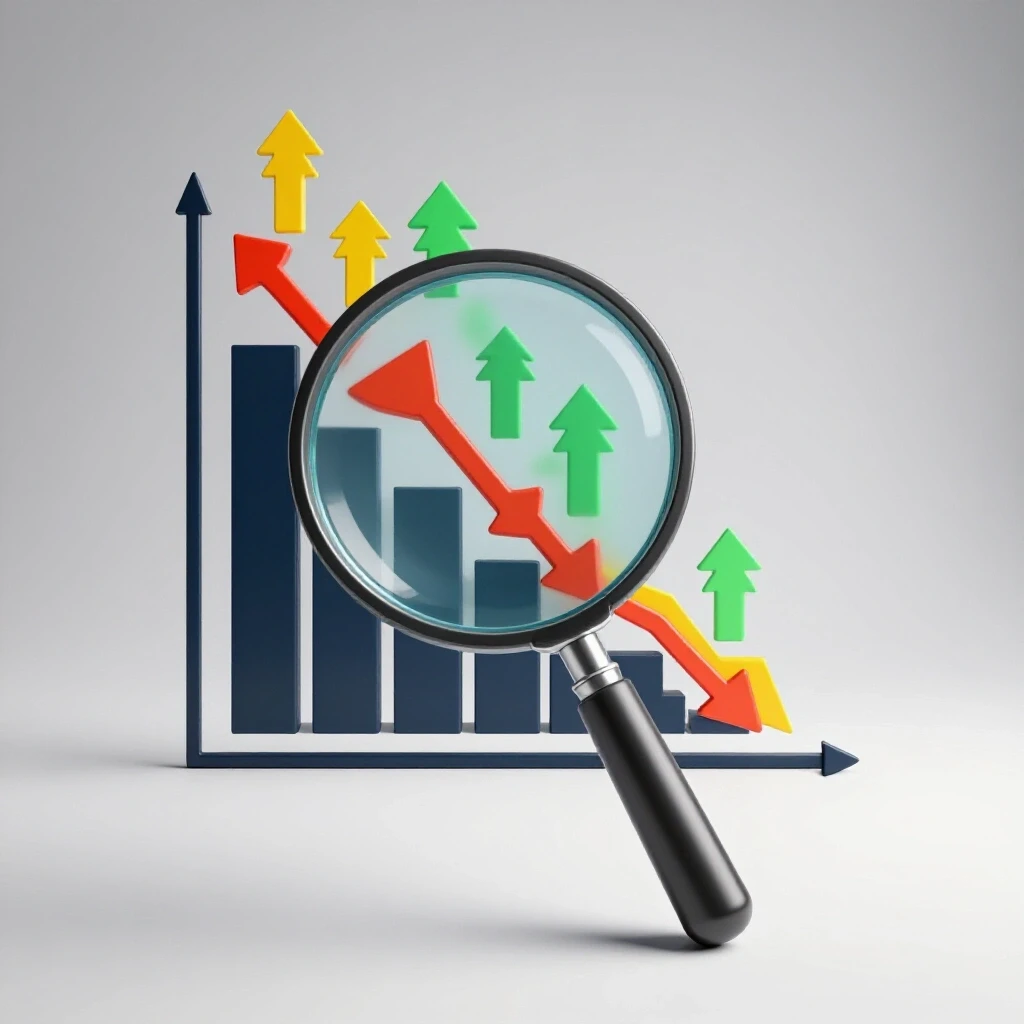
I remember sitting in a glass-walled conference room four years ago, staring at a reach chart that looked like a mountain cliff. A major retail brand I was managing had just seen its organic impressions fall by 70% in forty-eight hours. We hadn’t changed our posting frequency, and our likes were still decent, but the “new audience” reach had simply vanished. I spent weeks chasing “shadowbans” and checking for policy violations, only to realize the answer was hidden in a metric I had ignored for a decade.
Why Sudden Reach Drops Strike Brands—And How to Formulate a Root Cause Recovery Plan
Understanding why visibility vanishes requires looking past surface-level engagement. We must analyze how specific intent signals, particularly the rate at which users save content, influence the algorithm’s decision to keep distributing posts to new audiences over time. This metric serves as a primary indicator of content utility.
When a brand faces a sudden engagement drop resolution, the natural reaction is to panic and post more content. However, my experience shows that volume rarely fixes a reach problem. In that retail case, I eventually discovered that while people were “liking” our posts out of habit, they had stopped saving them. The platform’s algorithm interpreted this as a decline in value. We weren’t being “punished” for a violation; we were being deprioritized because our utility signal had flatlined.
To fix this, you need a diagnostic workflow. You must move away from vanity metrics and look at the “save-to-reach” ratio. This ratio tells you if your content is worth revisiting. If your saves are low, the platform assumes your content is “disposable,” which leads to a slow or sudden algorithmic penalty diagnosis.
Defining the Save-to-Reach Ratio in Modern Operations
The save-to-reach ratio is a percentage calculated by dividing total saves by total unique reach. It measures how many people found the content useful enough to bookmark for later. This is a high-intent action that platforms use to differentiate between “scroll-past” content and “high-value” content.
In my 14 years of operations, I have found that this ratio is the most accurate predictor of long-term account health. When this number stays above a certain threshold, reach tends to remain stable even during minor PR setbacks. When it drops, a reach collapse is usually only weeks away.
| Metric Type | Action | Algorithmic Signal Strength | Impact on Reach Recovery |
|---|---|---|---|
| Vanity | Like | Low | Minimal |
| Active | Comment | Medium | Short-term boost |
| Utility | Save | High | Long-term amplification |
| Viral | Share | High | Immediate reach spike |
Identifying the Hidden Signals of Algorithmic Penalty Diagnosis
When reach velocity drops, it often stems from a lack of high-intent signals like saves. Platforms prioritize content that users want to revisit, and a deficit here can trigger a suppression of future impressions. This suppression is often mistaken for a social media shadowban, but it is usually a performance-based throttle.
I once worked with a beauty brand that believed they were shadowbanned after a controversial product launch. They were getting thousands of angry comments, but their reach had hit a wall. When I audited their backend, the issue wasn’t the negative comments alone. It was that their “save velocity”—the speed at which a post is saved after being published—had plummeted to nearly zero.
The algorithm saw that nobody wanted to keep this content. It concluded that the brand was no longer providing value to the community. To recover, we had to stop addressing the controversy with “apology posts” that people just liked and moved past. Instead, we created “how-to” guides and ingredient breakdowns that forced the save velocity back up.
The Role of Search Suppression and Shadowbans
Search suppression occurs when a platform removes your content from hashtags or “Explore” pages without notifying you. This usually happens when your account’s safety score drops due to repeated policy flags or low-quality engagement signals. It is a protective measure by the platform to ensure user safety.
Understanding the difference between a technical penalty and a performance plateau is vital. If your content still appears for your followers but never reaches non-followers, you are likely dealing with a performance-based suppression. This is almost always linked to a lack of utility signals like saves.
- Check your Account Status: Most platforms now have a “Status” tool in the settings to show active violations.
- Test Hashtag Visibility: Post a unique, low-competition hashtag and see if your post appears in the “Recent” tab from a non-following account.
- Analyze Save Velocity: Compare current save rates to your 90-day baseline to see if the decline started before the reach drop.
Communicating Recovery Metrics to Stakeholders During a Crisis
Explaining a 40% reach drop to leadership is difficult and stressful. Shifting the focus to intent-based metrics helps justify the slow recovery process and sets realistic expectations for rebuilding brand reputation recovery. It moves the conversation from “why are we failing” to “how are we rebuilding utility.”
During a crisis, executives want to see a “V-shaped” recovery. In reality, audience reach recovery is usually a “U-shaped” process. I have sat in dozens of meetings where I had to explain that we couldn’t just “buy” our way out of a reach drop with ads. If the organic utility signals are broken, paid ads will only become more expensive and less effective.
I use a “Trust Recovery Phase Timeline” to manage expectations. This shows that the first 14 days are for stabilization, the next 30 days are for rebuilding utility, and only after day 45 do we expect to see reach return to previous baselines. This data-backed approach reduces the pressure on the social media team.
Creating a Shadowban Verification Matrix
A verification matrix is a tool used to determine if an account is facing a manual penalty or an algorithmic cooling period. It helps specialists identify the root cause by comparing different data points across the account’s history. This prevents teams from wasting time on the wrong solutions.
| Observation | Likely Cause | Recommended Action |
|---|---|---|
| Zero reach from hashtags | Manual Policy Penalty | Submit an appeal via platform support |
| 50% drop in Explore reach | Low Save Velocity | Shift to high-utility, “saveable” content |
| High reach but high unfollows | Audience Backlash | Implement community crisis management |
| Sudden drop after a “strike” | Algorithmic Suppression | 14-day “cool down” with zero policy risks |
Executing a Community Recovery Sequence Through Intent-Based Content
Restoring reach requires a tactical shift toward high-utility posts. By optimizing for save velocity, we signal to the platform that our account provides lasting value, which helps lift algorithmic penalties over time. This is the core of any successful audience crisis management plan.
When I am in the middle of an engagement drop resolution, I immediately pause all “brand awareness” posts. These are the polished, high-production videos that look great but offer little value to the viewer’s daily life. Instead, I switch to what I call “The Utility Pillar.” These are posts that are designed specifically to be saved.
For example, if you are a travel brand, stop posting pretty pictures of beaches. Start posting “The 5-Step Checklist for International Travel in 2024.” The first post gets likes; the second post gets saves. As those saves accumulate, the platform’s “quality score” for your account rises. Within two to three weeks, you will often see the reach on your other posts start to climb as well.
Steps to Implement a Data-Backed Recovery Campaign
- Audit the Last 30 Days: Identify which posts had the highest save-to-reach ratio, regardless of total likes.
- Identify the “Save Triggers”: Was it a list? A tutorial? A complex infographic? Find the format that worked.
- Draft a 14-Day “Utility Only” Calendar: Remove all fluff. Every post must give the user a reason to “keep” it.
- Monitor Reach Velocity: Track how quickly new posts reach non-followers compared to the previous week.
- Adjust Paid Support: Use small “Boost” budgets only on posts that already show a high organic save rate.
Implementing Ongoing Account Audits and Risk Containment
Long-term brand protection requires a proactive approach to monitoring platform health. Regular audits ensure that small drops in intent signals are caught before they turn into full-scale reach collapses. This is the “preventative medicine” of social media operations.
I recommend a monthly “Signal Audit.” Most managers look at total followers or total engagement. I look at the “Save-to-Reach” trend line. If I see that our reach is growing but our saves are declining, I know we are in a “bubble.” That bubble will eventually burst, resulting in a sudden reach drop.
By catching this early, we can adjust the creative strategy before the algorithm penalizes us. This keeps the account in a state of “positive momentum,” where the platform is constantly looking for ways to show our content to more people because our utility signals are consistently high.
Tools for Monitoring Brand Health and Reach
- Platform-Native Insights: Use the professional dashboard to export CSV files of post-level data for deeper analysis.
- Sentiment Monitoring Software: Use tools like Brandwatch or Sprout Social to track the “mood” of your comments during a recovery.
- Manual Reach Tracking: Keep a simple spreadsheet of “Reach vs. Saves” for every post to calculate your own velocity scores.
- Policy Databases: Regularly check the Transparency Reports from Meta, TikTok, and X to see how their moderation algorithms are changing.
Conclusion
Recovering from a major reach drop or a public relations setback is one of the most stressful experiences for a social media specialist. I have been there, watching the numbers turn red while leadership asks for answers. The key is to stop looking at the metrics everyone else sees and start looking at the one that actually drives the algorithm: utility.
By focusing on save velocity, you can systematically rebuild your account’s reputation with both the platform and your audience. It isn’t a fast process—most recovery campaigns take 30 to 60 days to show real results—but it is a permanent one. Once you understand how to trigger those high-intent signals, you gain a level of control over your reach that most marketers never achieve. Start by auditing your saves today; the data you’ve been ignoring might be the very thing that saves your account.
FAQ: Navigating Reach Recovery and Algorithmic Penalties
What is the “Save-to-Reach” ratio, and why does it matter? The Save-to-Reach ratio is the number of saves divided by the total unique reach of a post. It matters because it signals “utility” to the algorithm. High saves tell the platform that your content is valuable enough for users to want to see it again, which triggers the algorithm to show it to a wider audience.
How can I tell if I have a social media shadowban or just low engagement? A shadowban usually results in zero reach from non-followers (people who don’t follow you), especially from hashtags or the Explore page. Low engagement usually means your reach is still there, but people are scrolling past without interacting. Check your “Account Status” in settings for any active policy violations.
How long does it take to see an audience reach recovery? In my experience, a methodical recovery takes between 30 and 60 days. The first two weeks are spent stabilizing the account and removing low-performing content. The following month is focused on rebuilding utility signals. You cannot “reset” the algorithm overnight.
Should I stop posting if my reach drops suddenly? No, but you should change what you post. Stopping entirely can signal to the algorithm that the account is inactive. Instead, reduce your frequency and focus exclusively on high-utility content that encourages saves and long-form viewing.
How do I explain a reach drop to my boss without sounding incompetent? Use data to show that the drop is a platform-wide algorithmic shift or a specific performance-based cooling period. Present a “Root Cause Recovery Plan” that focuses on intent metrics (like saves) rather than vanity metrics (like likes). Show them the “Trust Recovery Phase Timeline” to manage their expectations.
Can paid ads help fix an algorithmic penalty diagnosis? Ads can help maintain some visibility, but they do not “fix” the underlying organic reach problem. If your organic save velocity is low, your ads will likely have a high cost-per-result. Use ads sparingly on your best-performing organic content to supplement recovery, not replace it.
What are the most common rookie mistakes during a reach collapse? The biggest mistakes are “engagement baiting” (asking for likes/comments in a desperate way), deleting and reposting content, or buying fake engagement. These actions often trigger more severe penalties because they signal to the platform that you are trying to game the system.
Is save velocity the only metric that matters for recovery? While it is the most underutilized, it works alongside “Watch Time” and “Share Velocity.” However, for brand accounts facing a crisis, saves are the strongest indicator of rebuilt trust and utility.
What should I do if my platform appeal is rejected? If a manual appeal is rejected, do not keep submitting the same request. Wait 7–10 days, gather more data to prove your account is following guidelines, and try again. In the meantime, focus on “cleaning up” your existing content to improve your overall account health score.
How do I prevent a future reach drop? Conduct a monthly “Signal Audit.” Track your save-to-reach ratio and ensure it stays consistent. If you see it dipping for three consecutive posts, adjust your creative strategy immediately to include more high-utility content before the algorithm takes notice.
(This article was written by one of our staff writers, Andrew Collins. Visit our Meet the Team page to learn more about the author and their expertise.)